WellDatabase contains billions of data points. Making sense of it all can be a time consuming and confusing process. Fortunately, we have created analytical tools that can help you get up to speed. Here is a rundown of the WellDatabase analytic tools, with links to more specific articles for each type.
If you're not already seeing the analytics pages, you might need to enable the view by clicking on the Analytics button in the top right.
 For more details on customizing your view see our detailed page:
How do I toggle my Map, List, and Analytics screens?
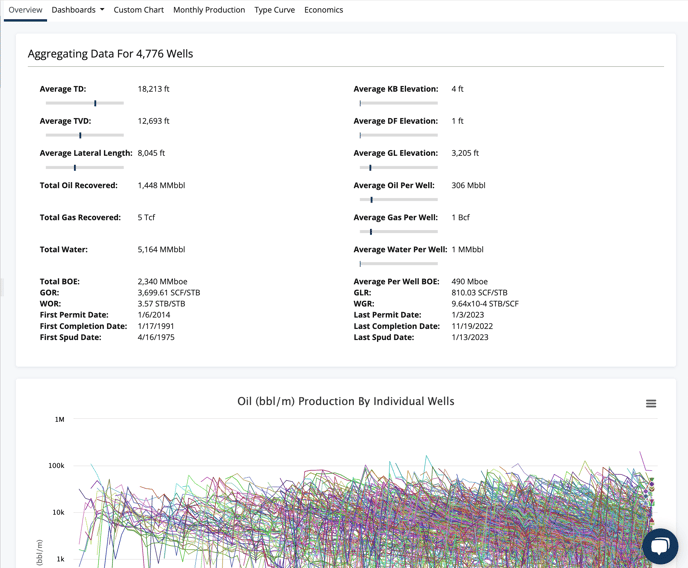
Overview
The overview page is designed to give you quick feedback on your current search. The data becomes more granular and useful as you refine your search results.
For more details on the overview page, see the following page:
What data is displayed on the Analytics Overview page?
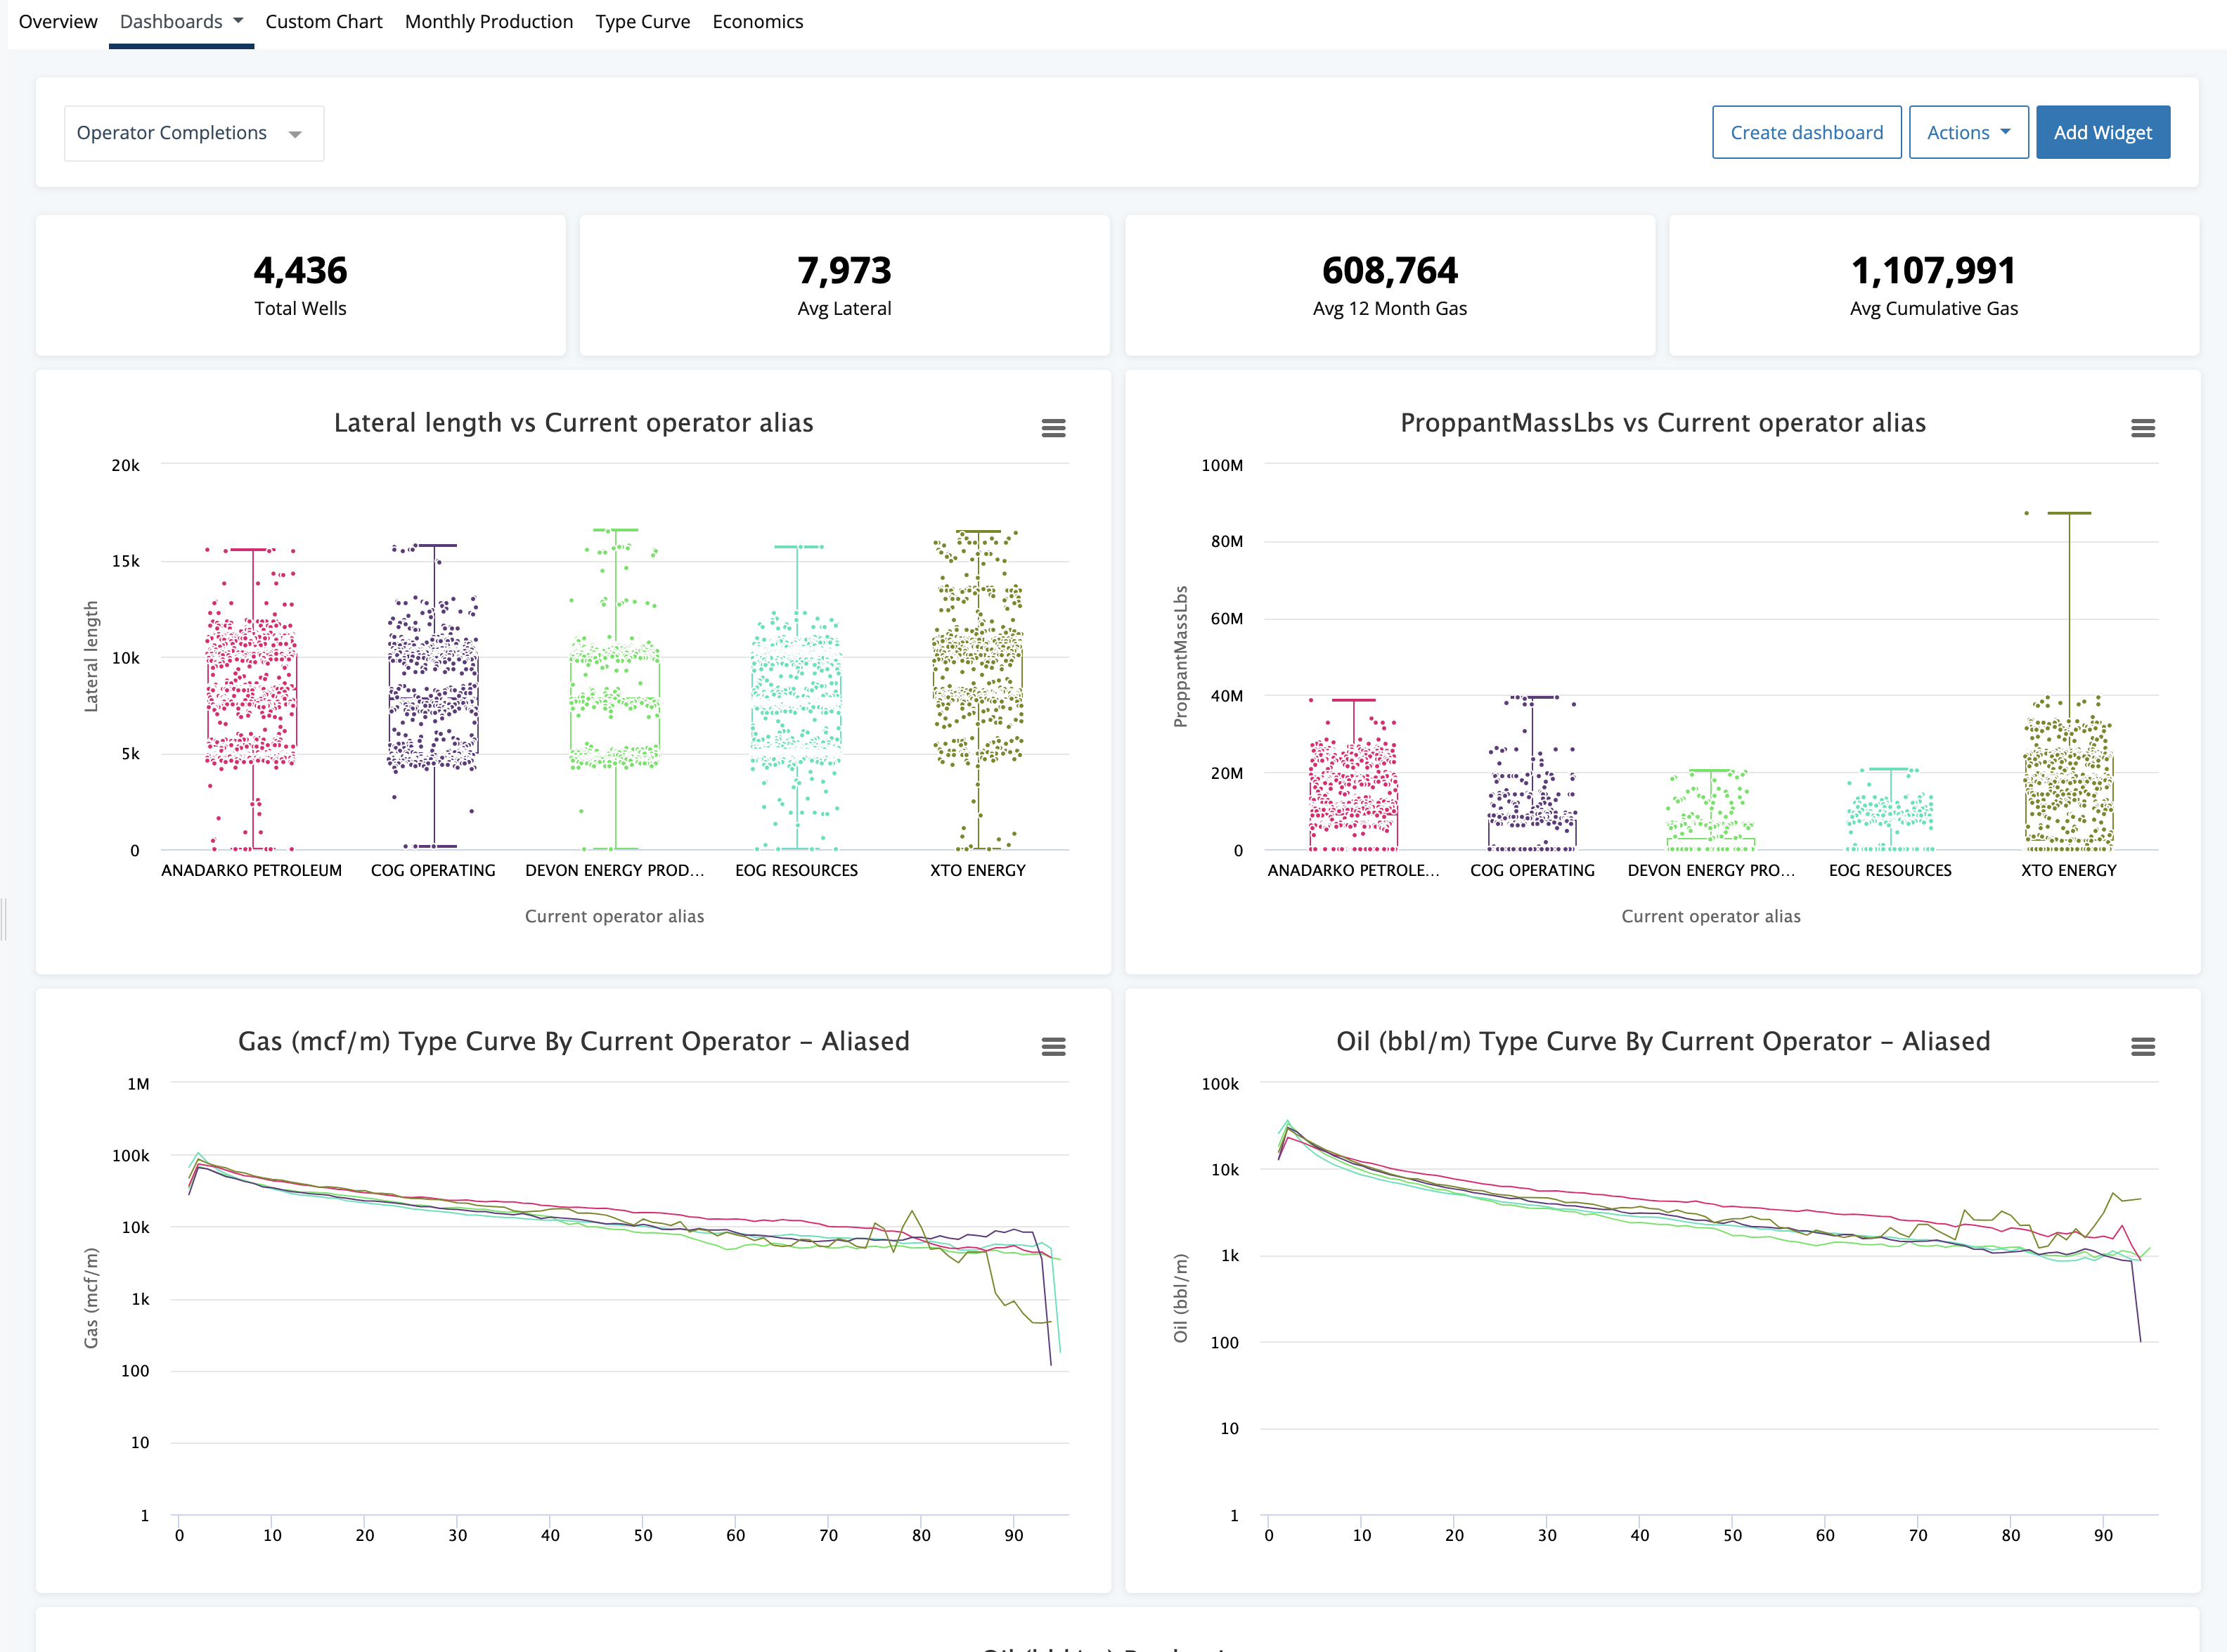
Dashboards
The dashboard dropdown contains all of our analytic breakdowns in one simple package. The types of analytics here are based on the following data:
- Rigs - Current and historical rig and drilling activity
- Permits - Breakdowns of all types of permits filed
- Completions - Completion numbers and roll-ups of different completion data points
- Stimulations - Primarily frac related analytics with some alternative well stimulations included
- Tests - Break down of measured test data volumes, pressures, and more
- Production - Production comparison charts to compare operators, vintage, and more
- Injection - Water, CO2, Gas, & more injection volume comparisons
- Disposition - Breakdowns on how much production is trucked, pipelined, flared, and more
- Dashboards - Customizable dashboards that allow for breakdowns of just about anything
The dashboards can be broken into 3 groups, volumetric based, event based, and fully customizable. Volumetric dashboards focus on time series based volume data. These include production, injection, & disposition. The event dashboards are based on breakdowns of specific events and the properties of those events. These include permits, rigs, completions, stimulations, & tests. Finally, dashboards are a fully customizable option that allow you to drop any combination of charts to get the data you need.
For more information on dashboards, see the following pages:
What is displayed on the volumetric analytic pages?
What is displayed on the event analytic pages?
What dashboards are included with WellDatabase?
How do I make a custom Dashboard?
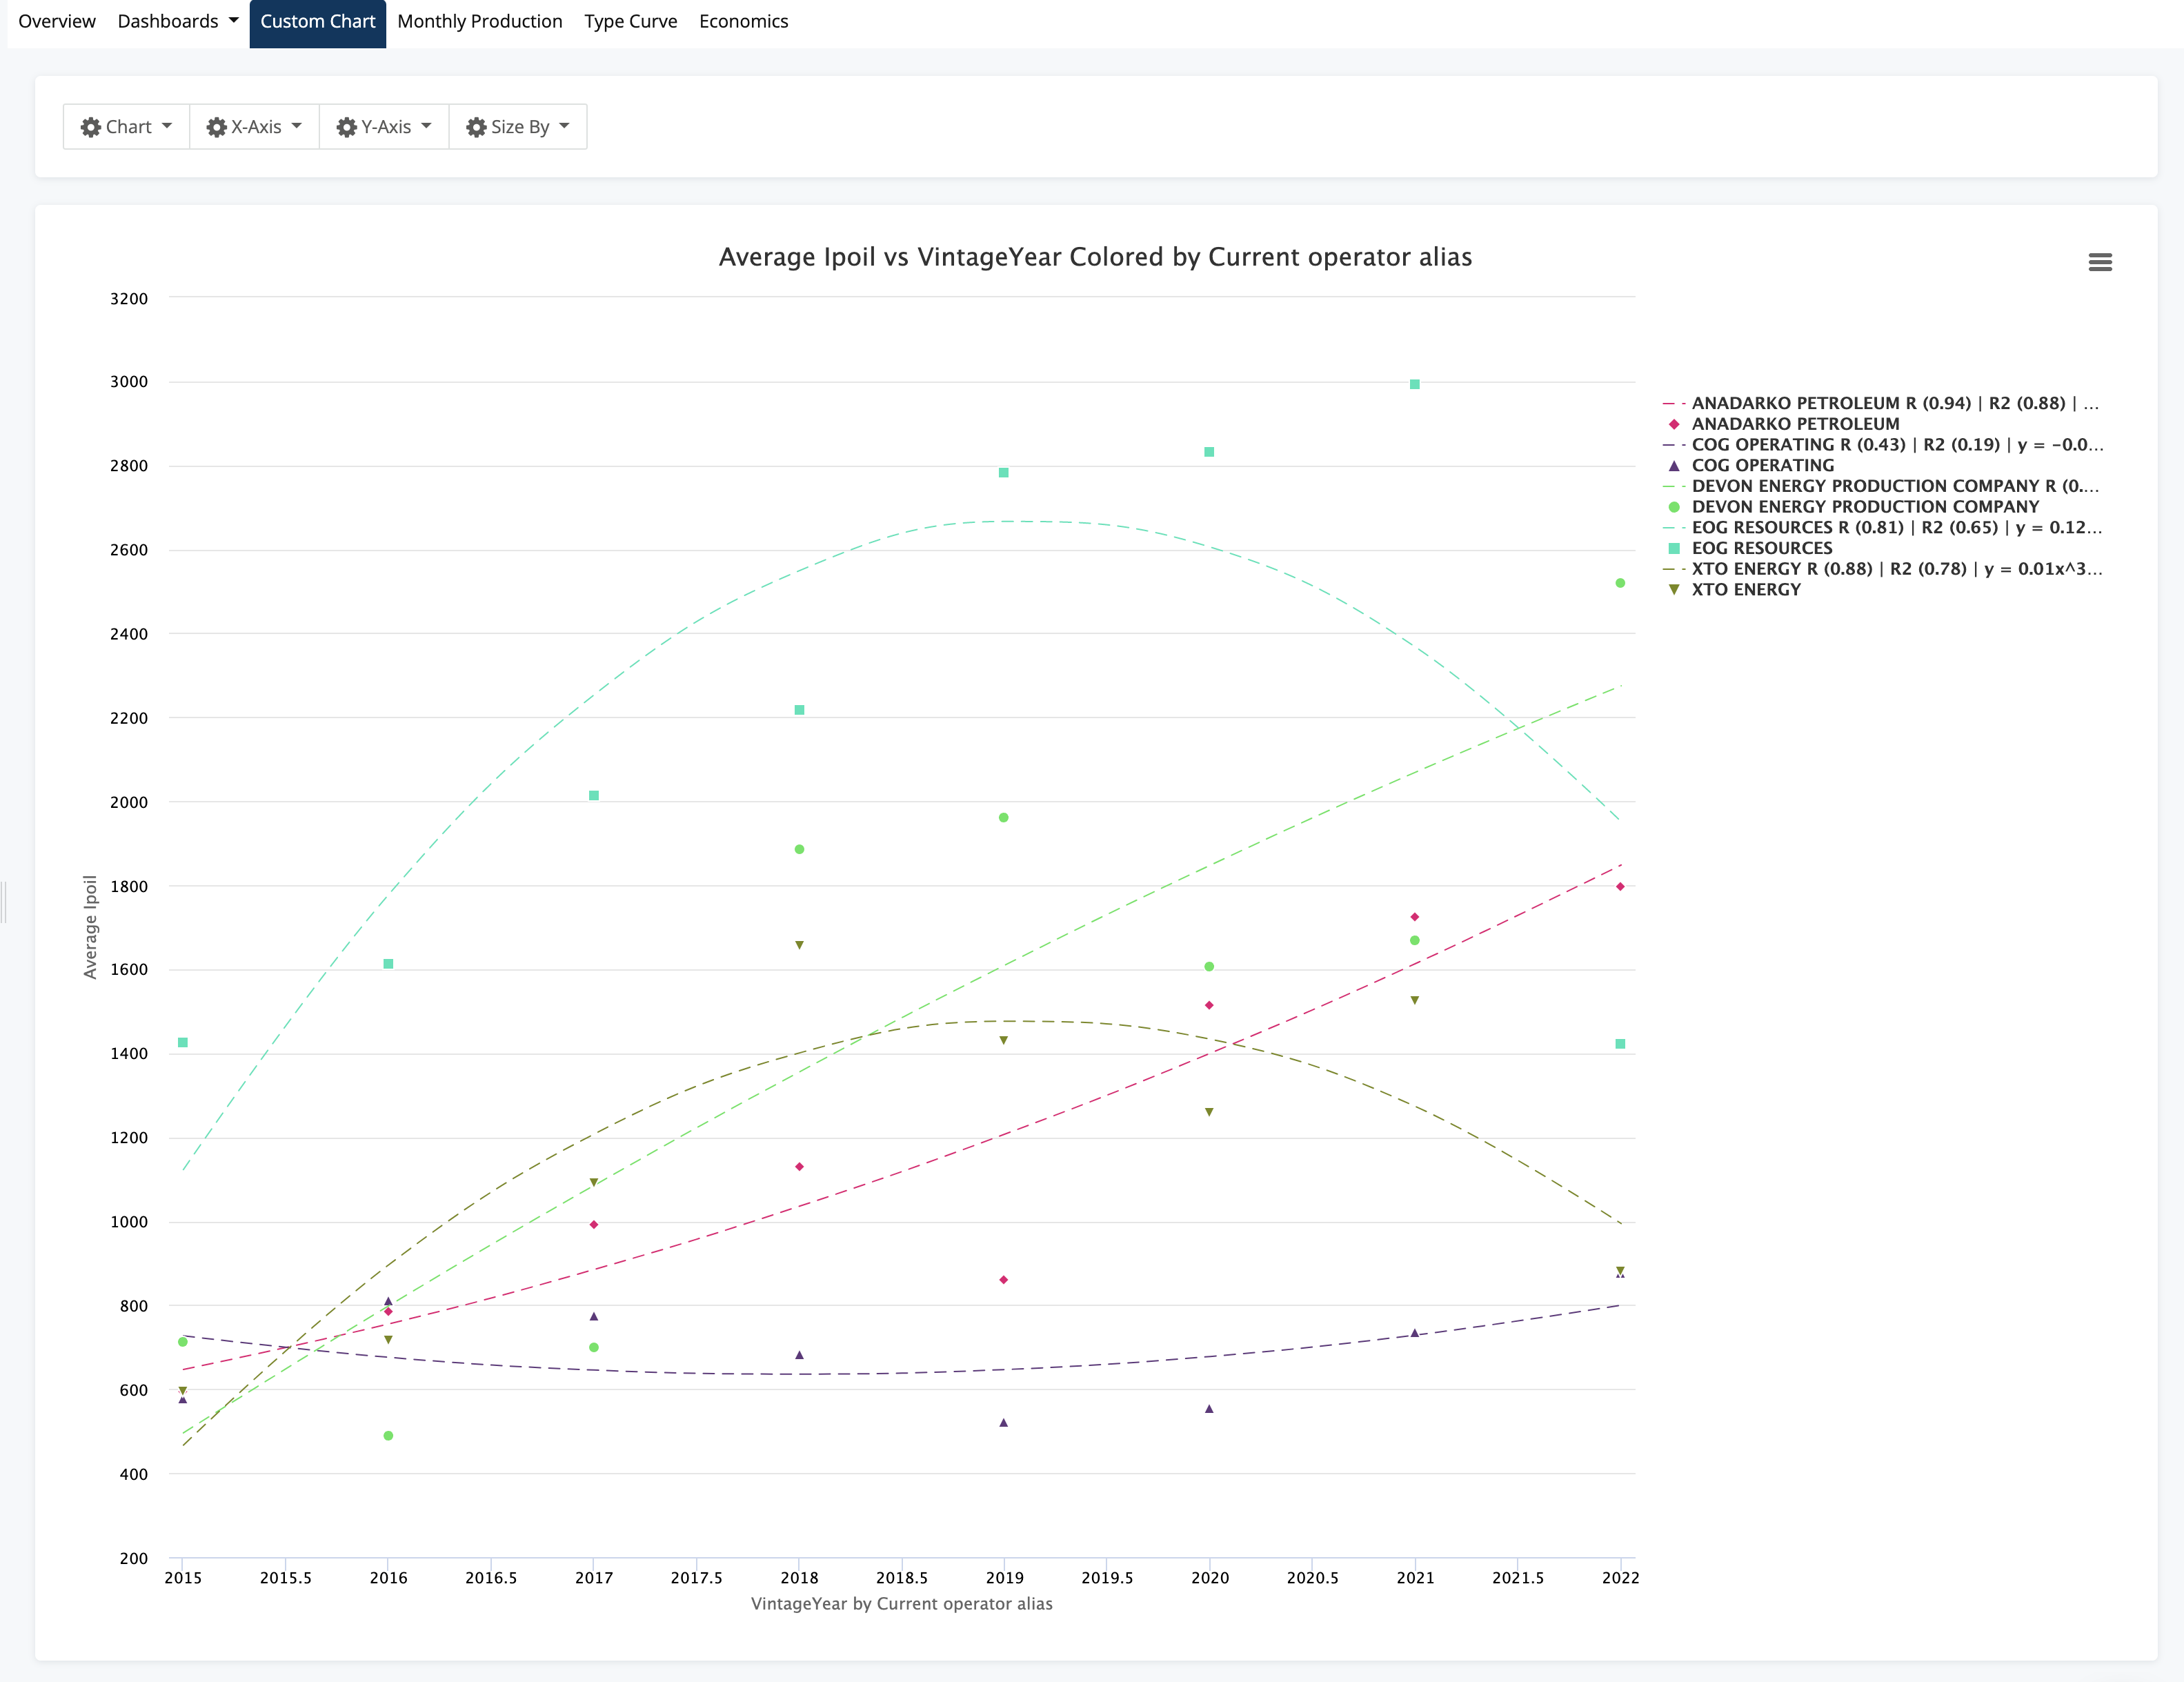
Custom Chart
The custom chart is a very open chart builder that lets you plot nearly any value in WellDatabase. The chart supports multiple chart types, time series data, properties of all kinds, and the ability to aggregate it all. The chart is very...well..customizable. In addition, you can directly attach the charts you make here to any of your dashboards.
For more information on the custom chart, see the following page:
How do I use the Custom Chart?
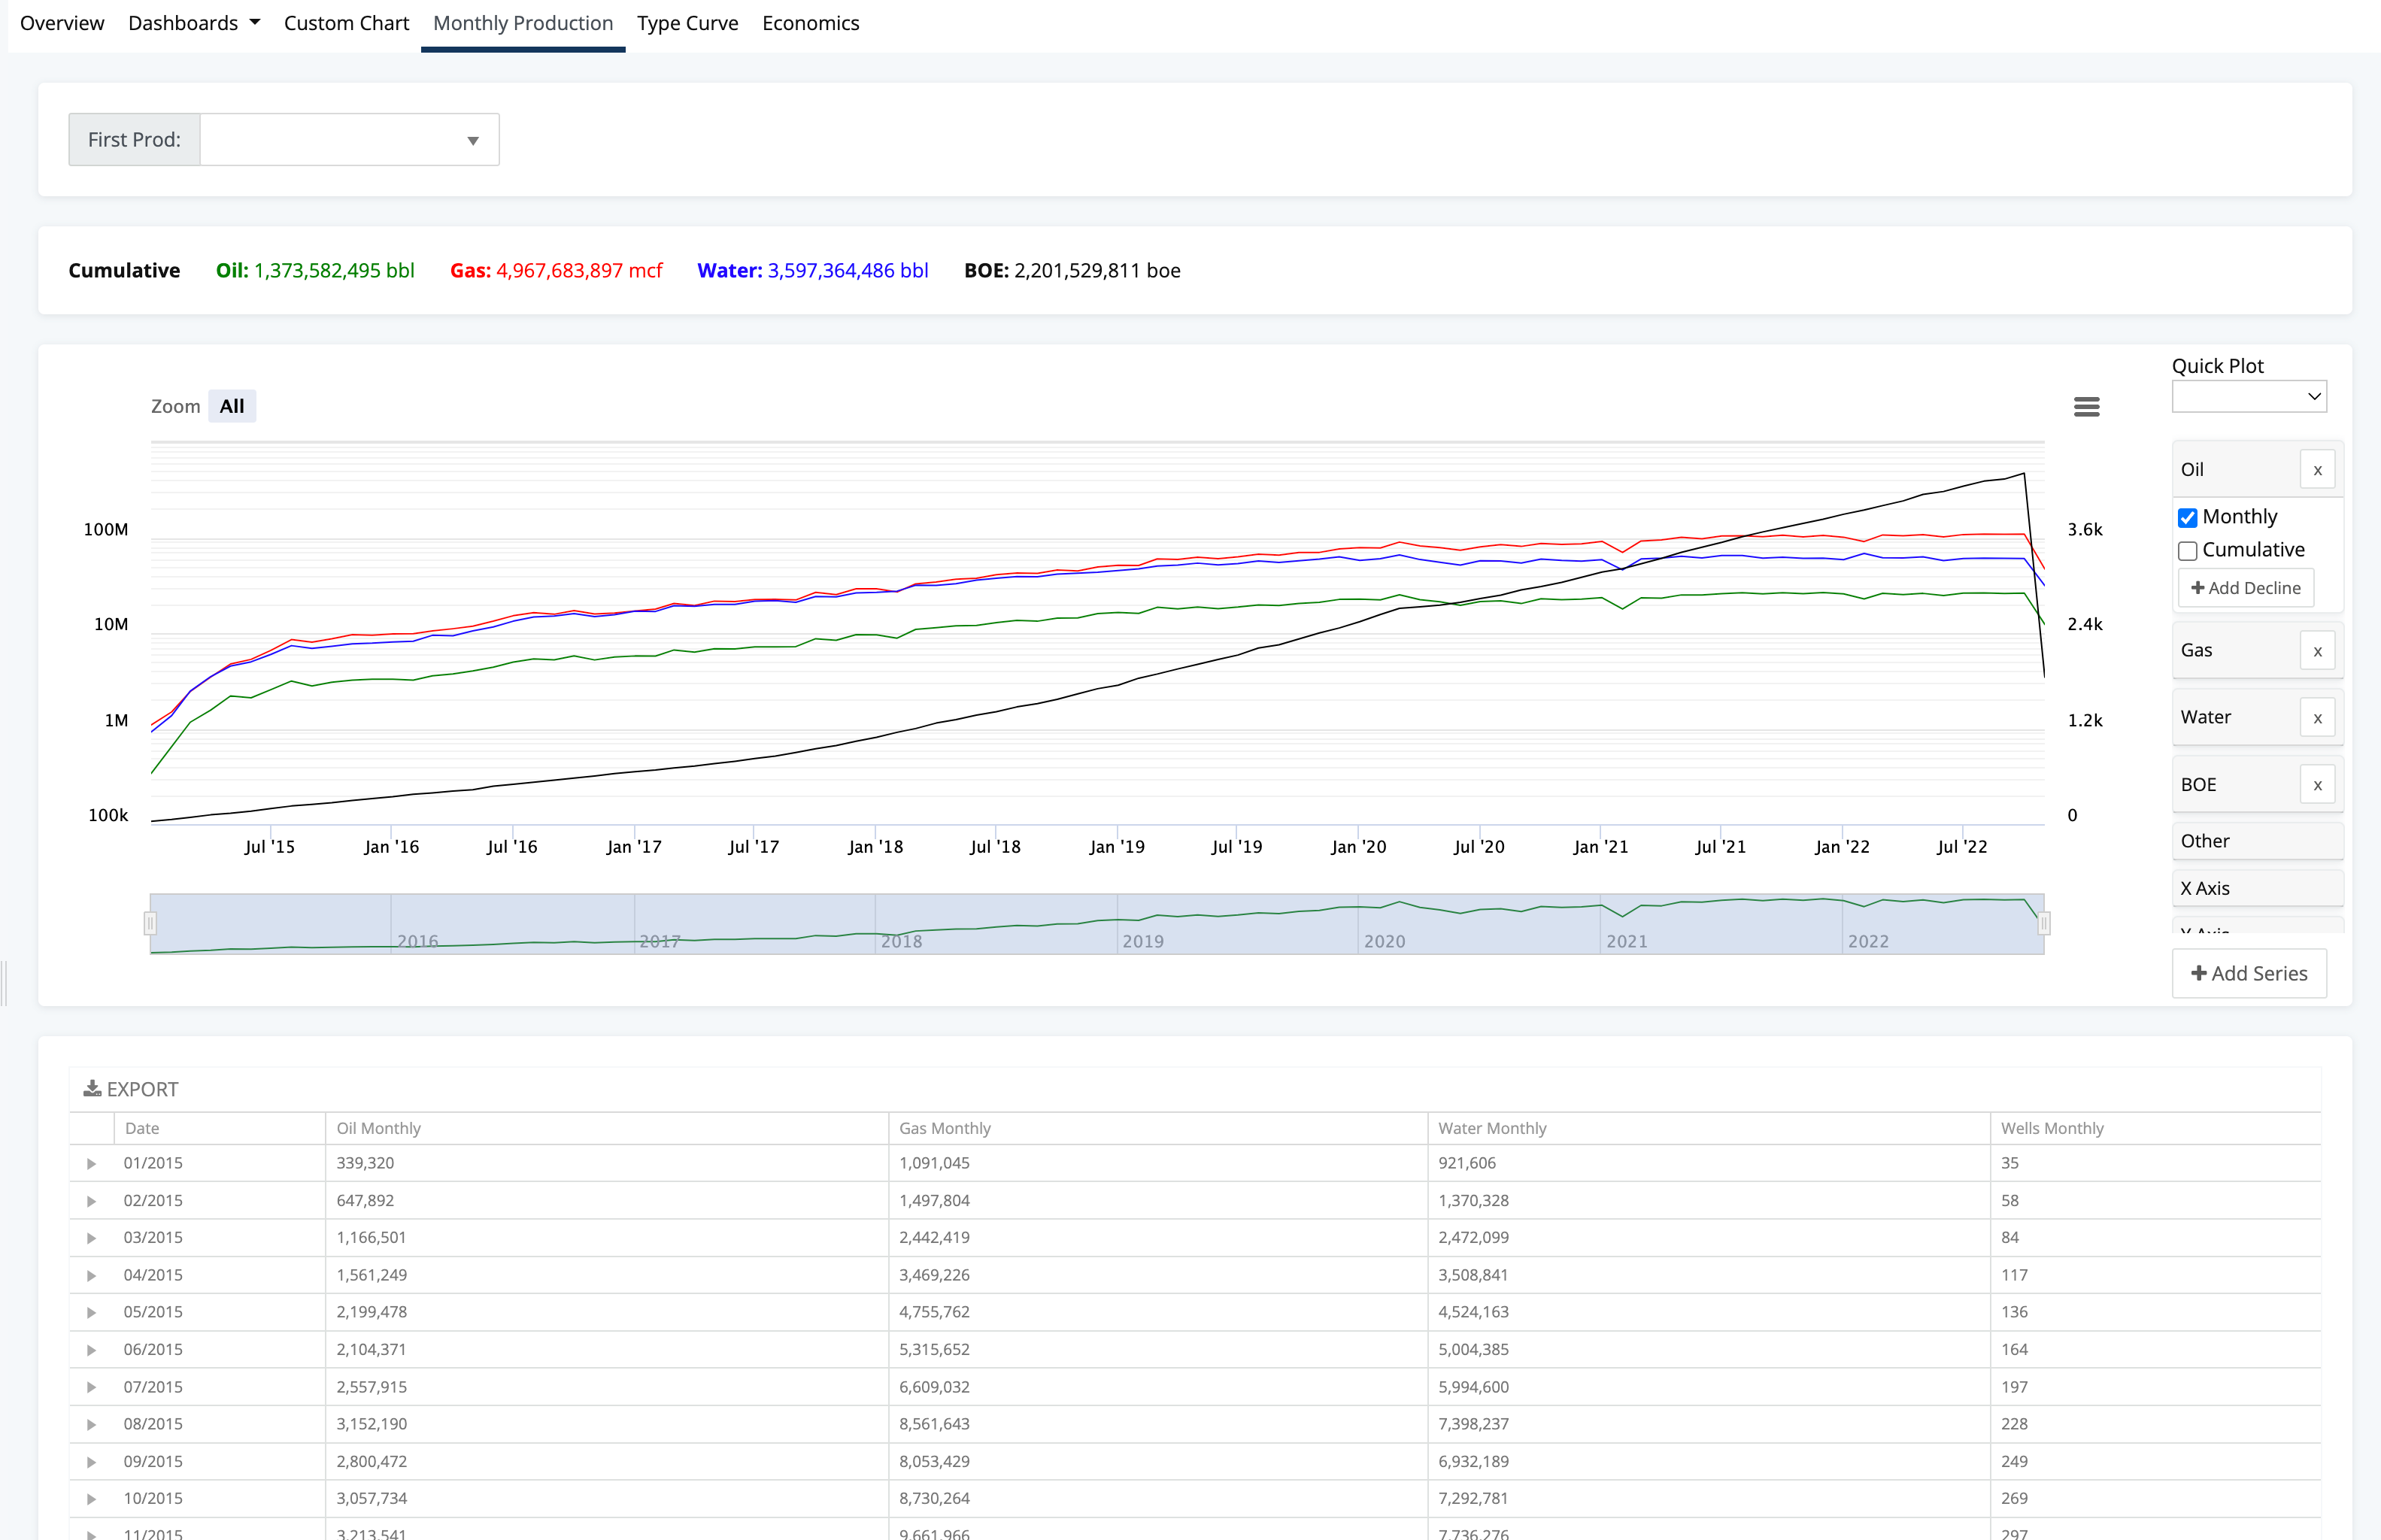
Monthly Production
The monthly production tab gives you a total production chart for all wells in your current search. Additionally, you can view a table of each month that expands to show the individual wells that make up that volume.
To learn more about the monthly production chart, see the following page:
How does the Monthly Production page work?
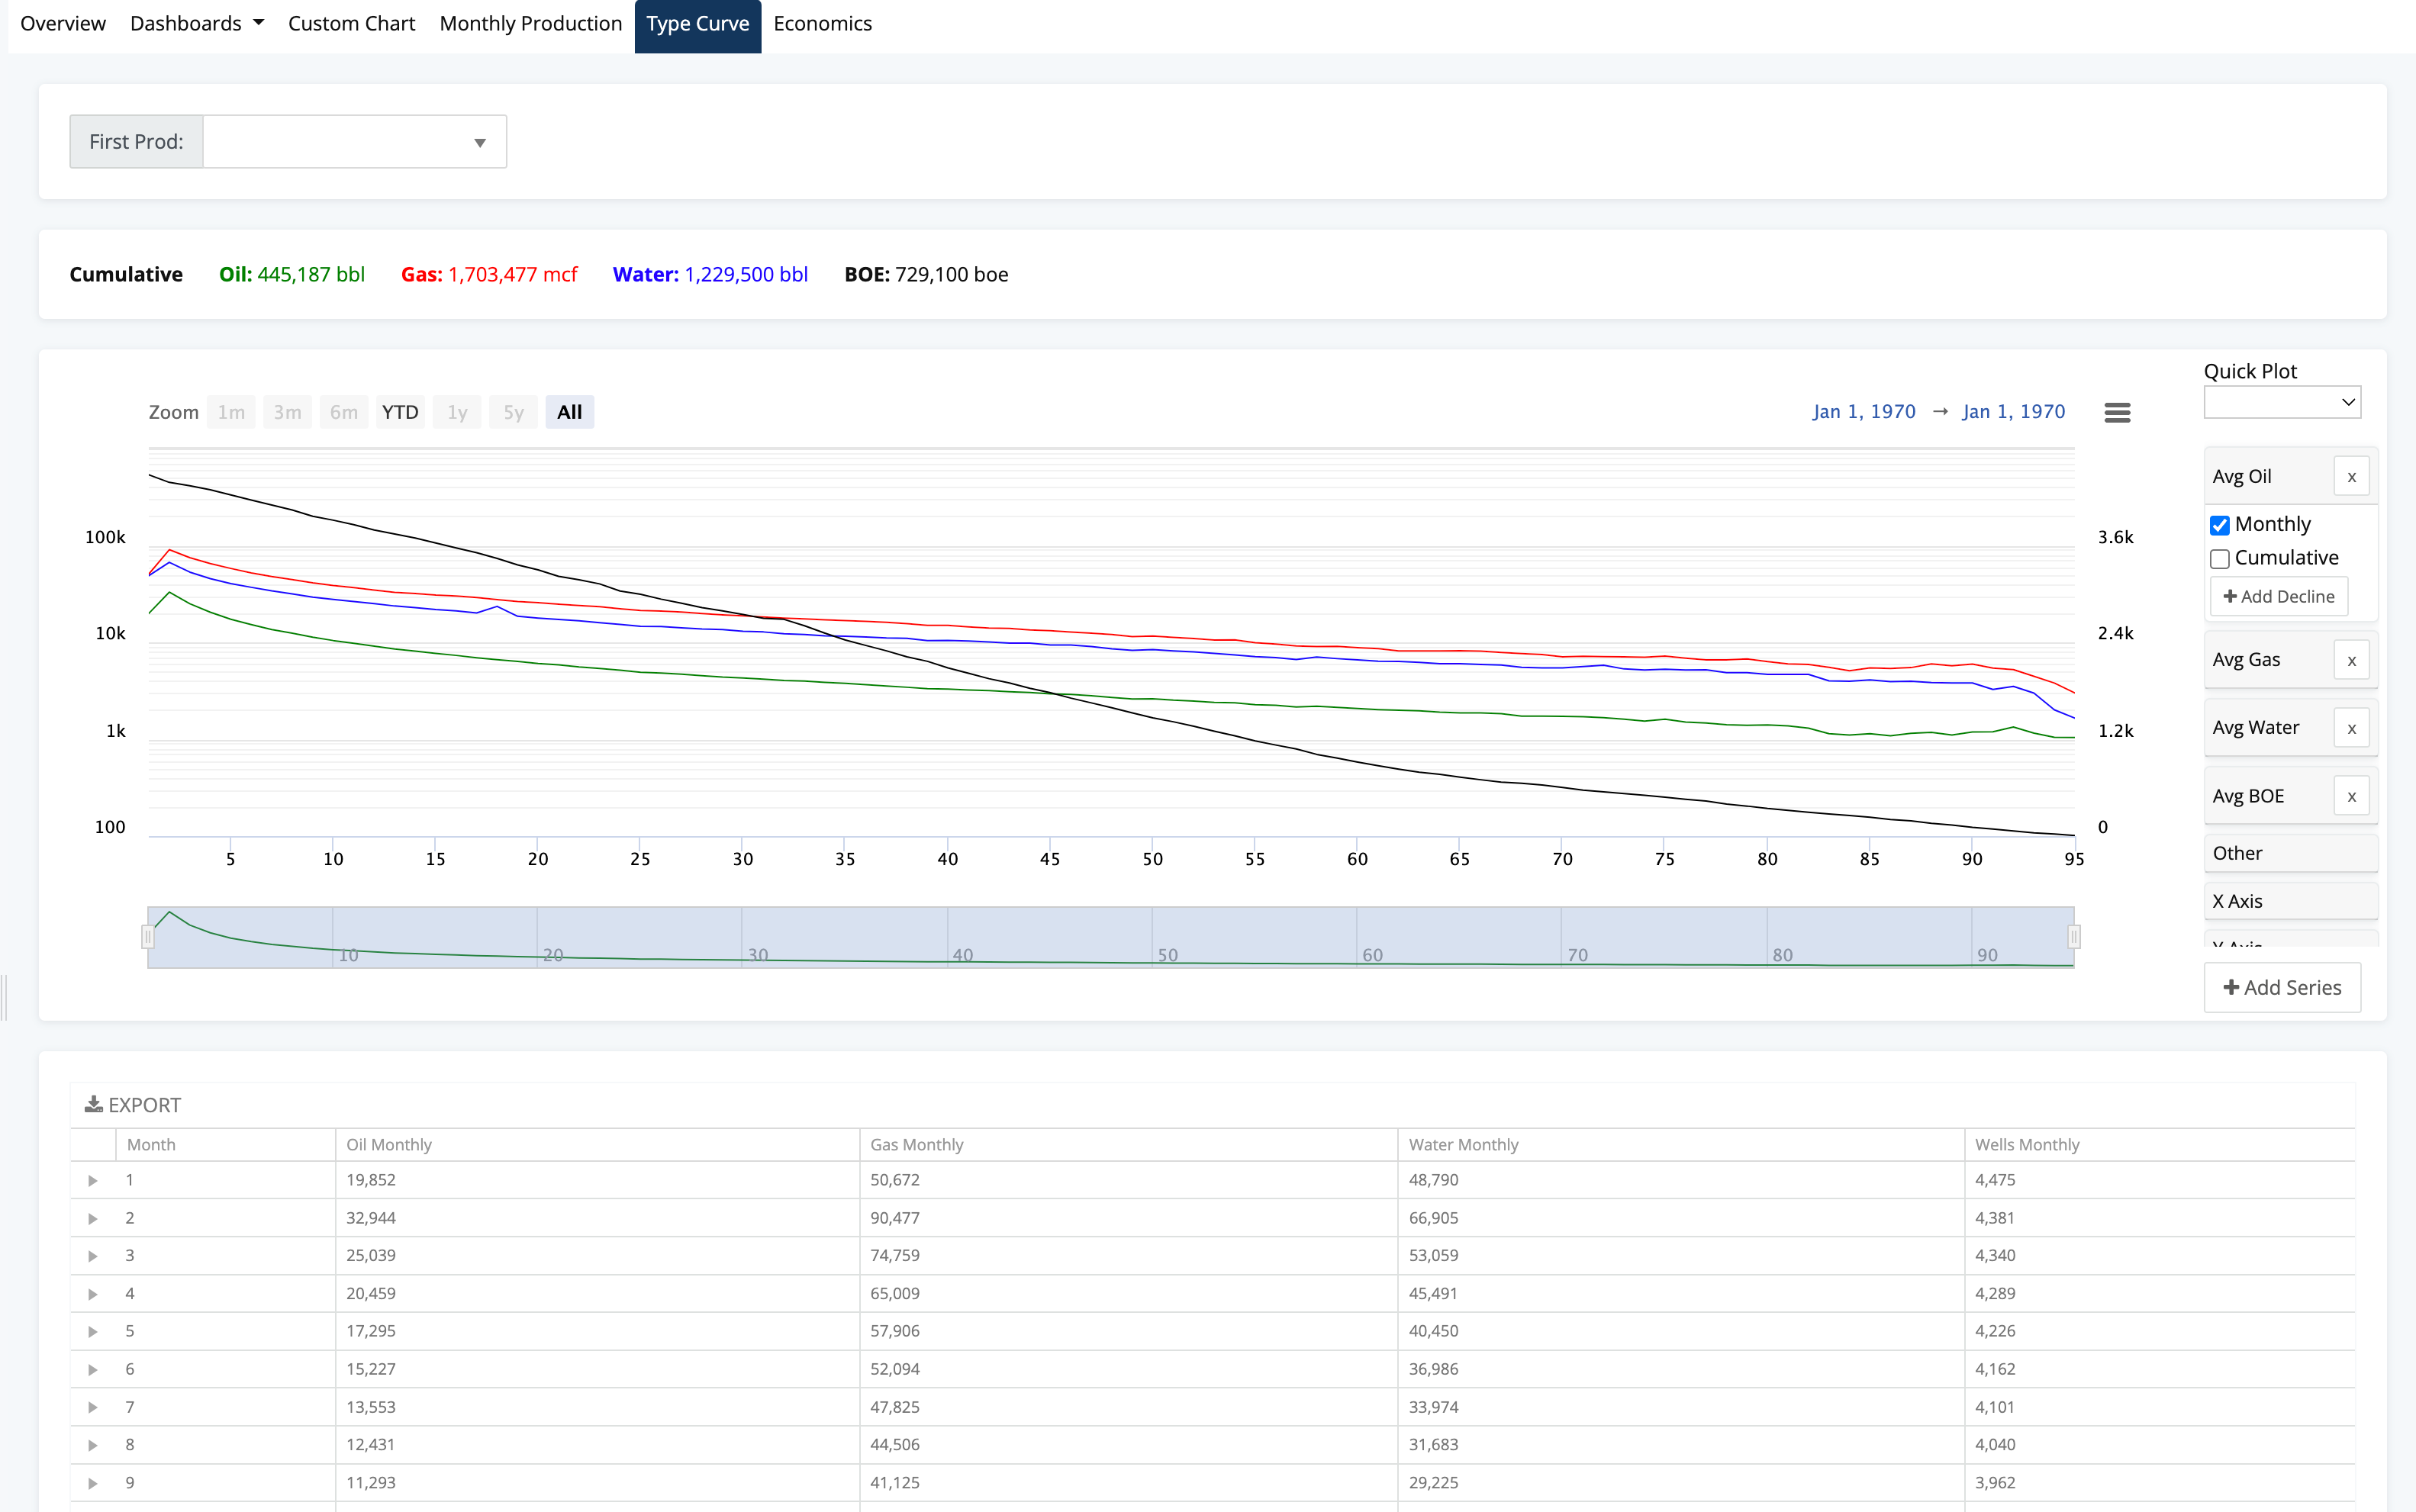
Type Curve
The type curve tab is similar to the monthly production chart, only ordered by month number. This gives you a view of a "type well" based on your search criteria. This is a great way to see the typical well and perform high level decline curve analysis.
To learn more about the type curve chart, see the following page:
What is the Type Curve analytic page?
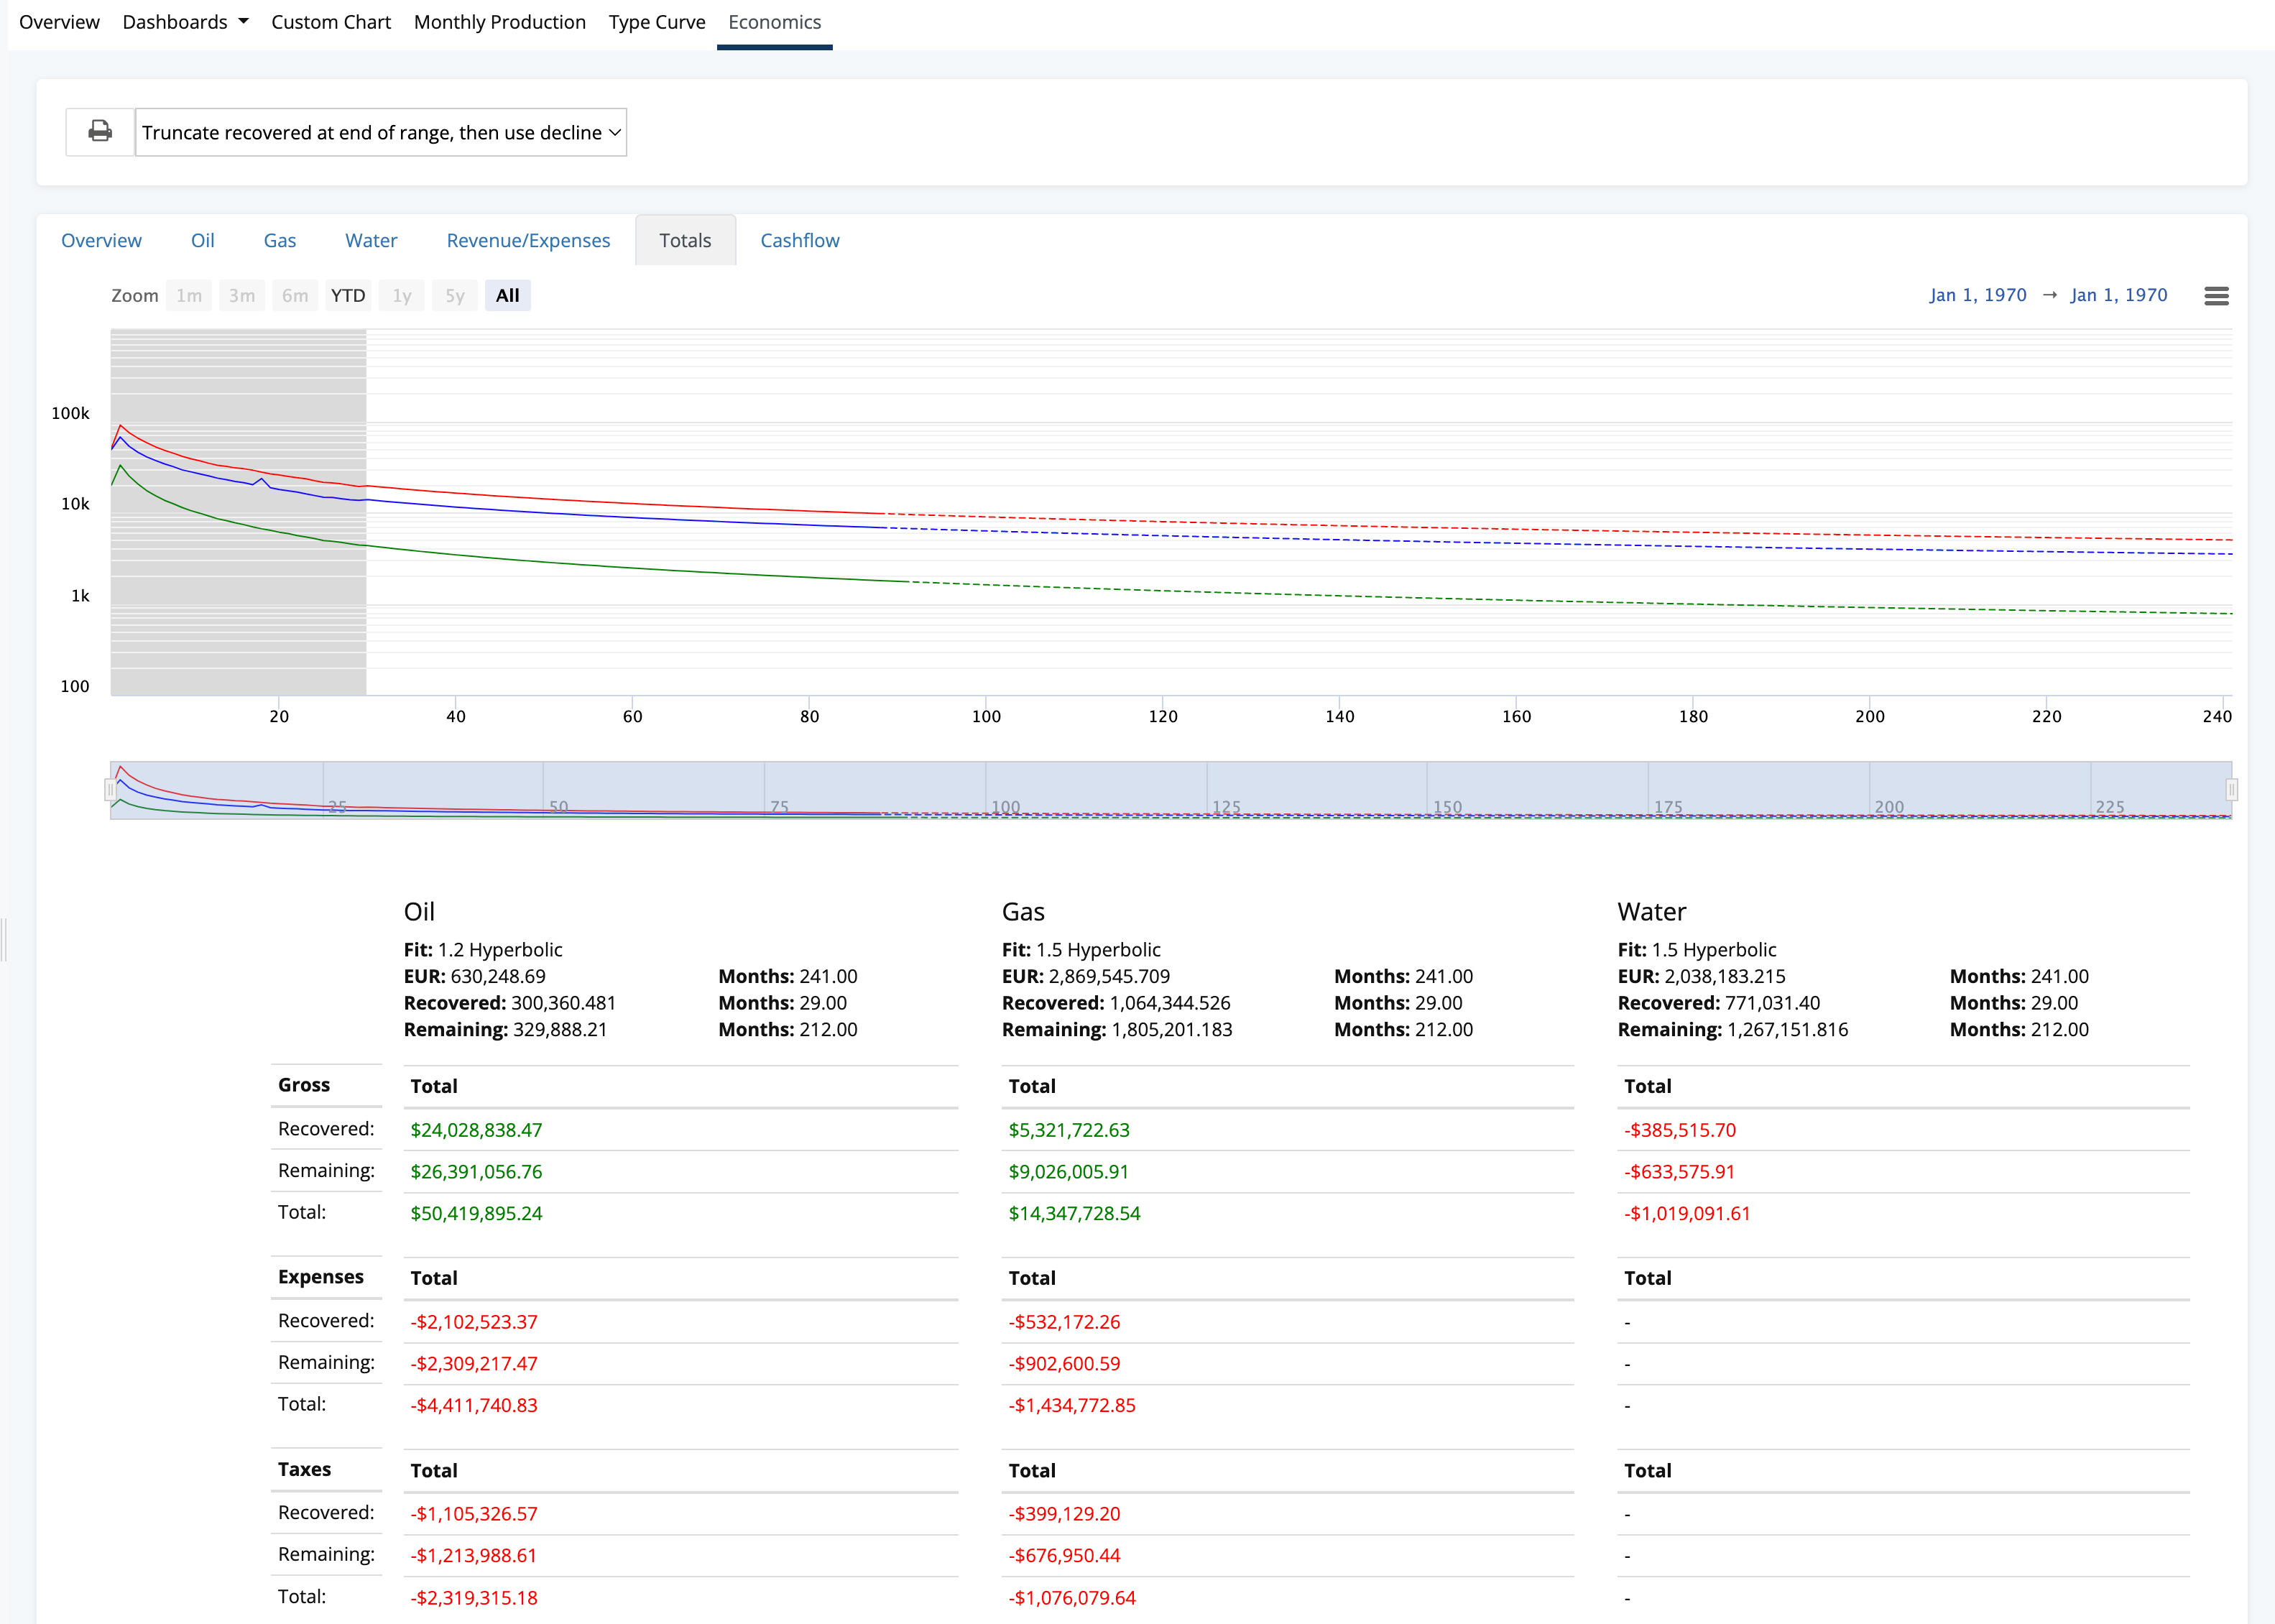
Economics
The economics tab allows you to create basic economic profiles based on type curves, basic commodity costs, and a handful of variable expenses. This tool is mean to give a quick look at the economics of an area and is not intended to be a replacement for a full economics platform.
To learn more about the economics tool, see the following page:
How do I use the WellDatabase Economics tool?