WellDatabase dashboards provides users with many different system reports. If you don't see the exact dashboard you are looking for - create your own. Custom dashboards give you the flexibility to decide how your data is organized.
To create your own dashboard, navigate to the analytics tab, then select dashboards under the dashboards tab.
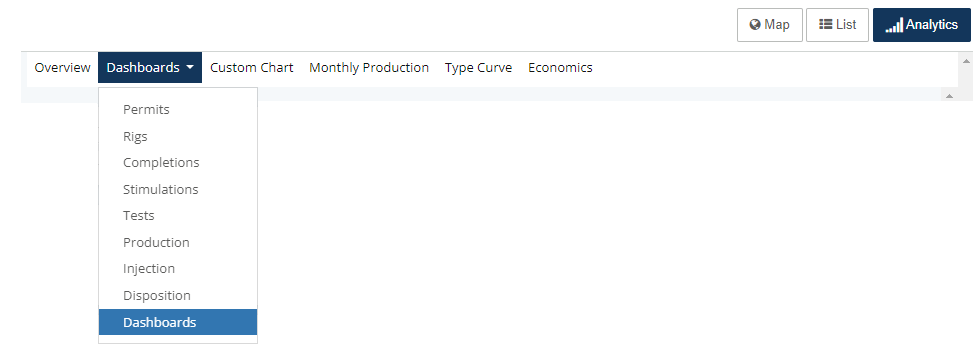
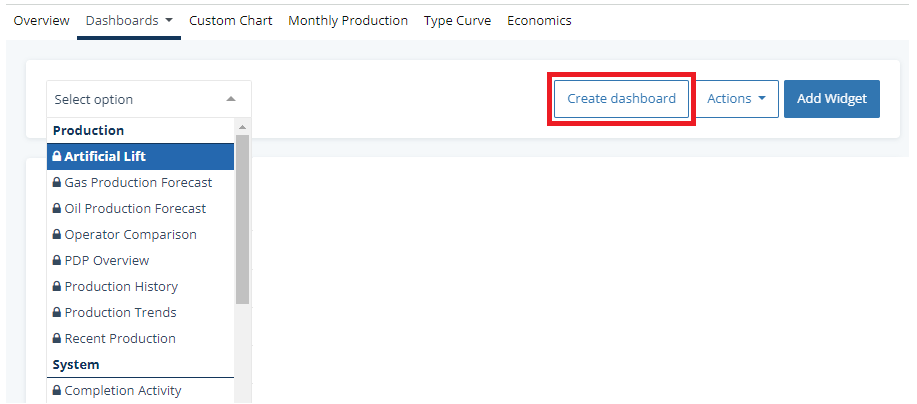
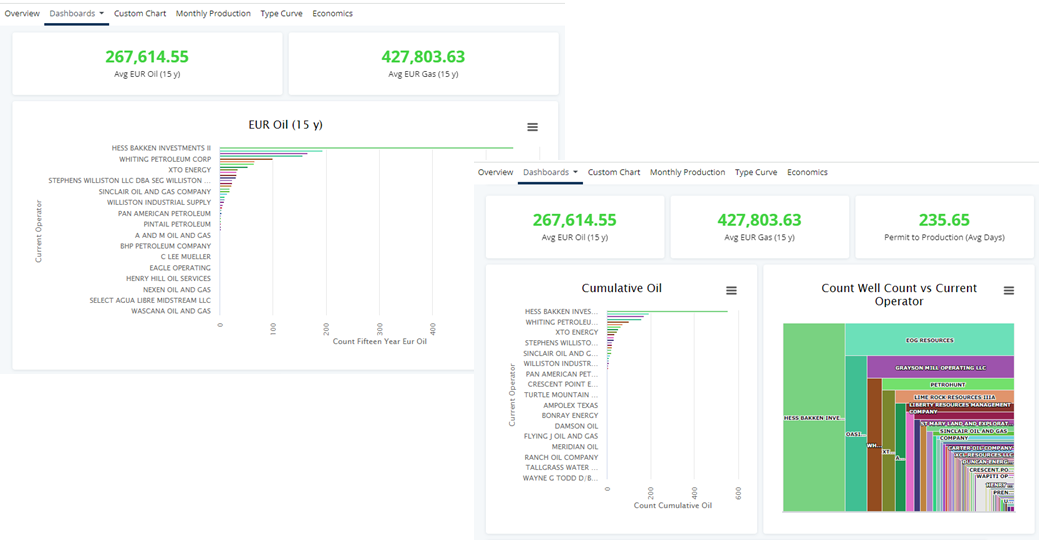
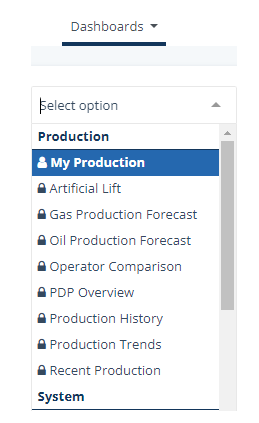
After selecting dashboards, use the dropdown to see the available dashboards. You can use any of these as a template to create your customizable dashboard - or you can start with a blank screen.
Click 
Complete the free-form text for name, category and description. Select a template.
Then click 
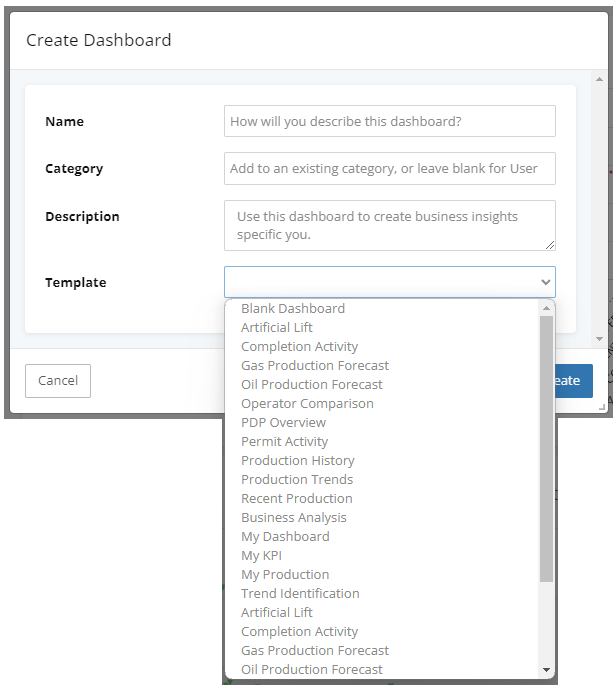
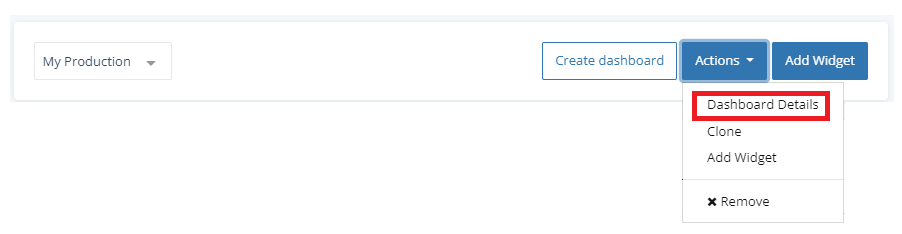
Any of these details can be changed at any time by clicking Actions>Dashboard Details.
Blank Dashboard
Starting with a blank dashboard is helpful when there is a specific goal for this dashboard and the system or user dashboards have little to no similarities.

Start by adding a widget and choose from a chart type, KPI or an external page.

Pick up any card to move it and drag the card to the new location.
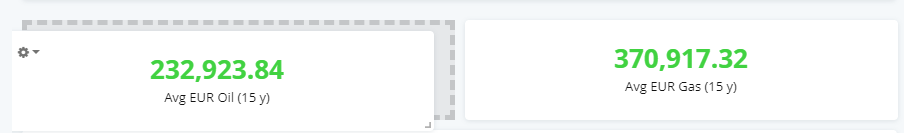
Adjust any chart or KPI card size by clicking and holding the bottom right corner of the card to resize it.
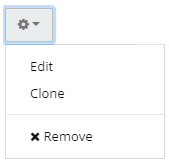
Click the  on any chart or card to edit the existing data points, to clone it, or to remove it completely.
System Dashboards vs User Dashboards
The icon next to each dashboard name is an easy way to identify if you are working in a user or a system dashboard.
 User
User
 System
![]()
When working inside of system dashboards, edits are not permanent and will go back to their default data points after exiting the dashboard. To make permanent modifications to these charts, create a custom dashboard - using the system dashboard as a template.