Creating a simple decline curve on a single well to forecast production is imperative part of many workflows. WellDatabase enables you to do this in seconds.
Getting Started
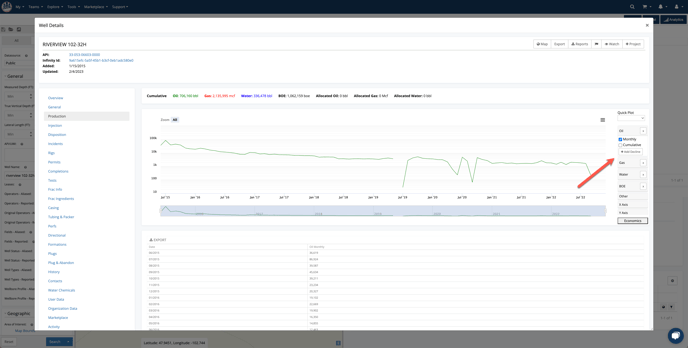
To start, we have opened a well and navigated to the production tab. We are going to start with the oil production, so we have hidden the other streams. To read more about the production chart and its capabilities, check out this doc.
The decline curve tool will utilize the visible production range to create a decline curve. Sometimes the most recent months of production can be more volatile. In these cases, it is best to zoom into the region that is more consistent.
Once you have a good section, click on the stream you want to decline and click the + Add Decline button.
There are several decline options to choose from. To read more about the decline options, see our document on decline curve settings.
For this example, we generated the curve using the best fit.
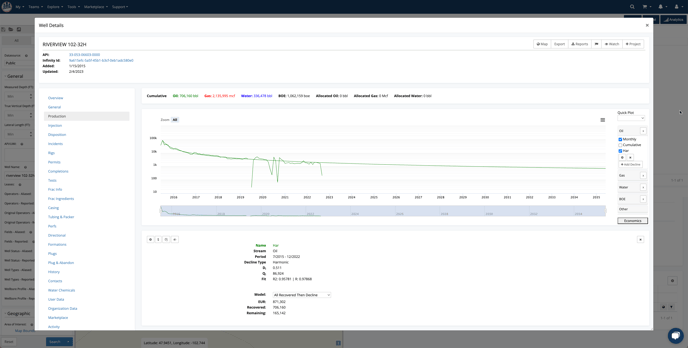
The decline curve production numbers are now on the chart and in the table below. You can export either of these data sets. For more information on that, read exporting charts and exporting tables.
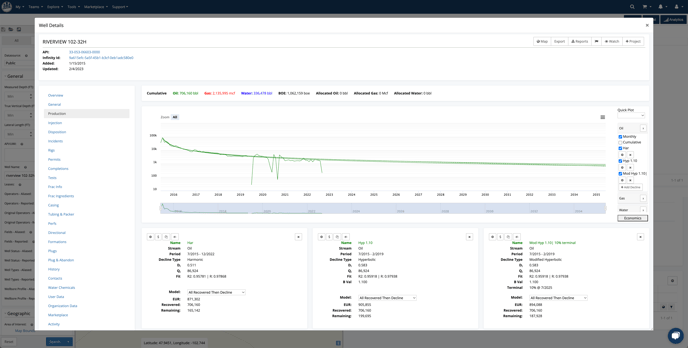
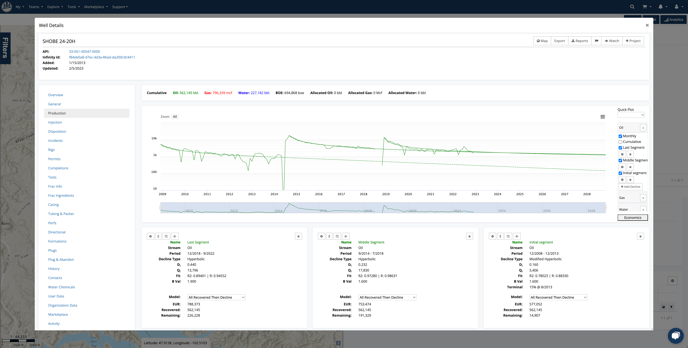
We also have a production decline card that gives you vital information about the decline parameters, fit, and EURs. One great feature is the ability to add additional declines and quickly compare the curves, and the cards it makes. Here's a sample of 3 different declines on this well.
There are also cases where you might need multiple decline curves on a well. Take this well for example.
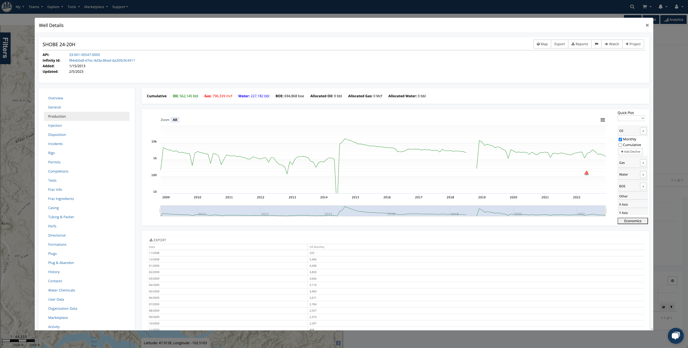
One cool thing we can do on this one is create 3 declines based on the distinct production segments. All we need to do is zoom in to each section and create a decline. What we get is below.
We can also tweak each of them independently to see the effects of things like terminal decline or variances in b-values.
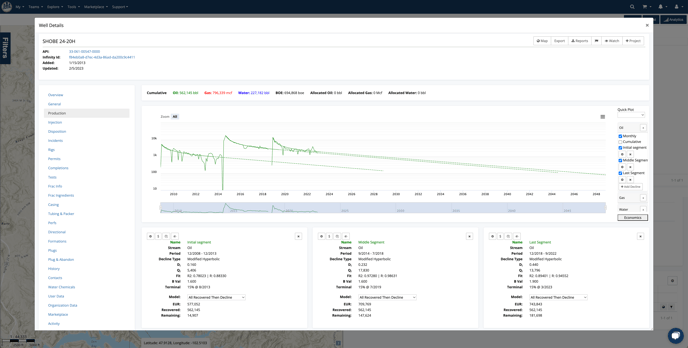
Now you can see the first two completions had similar decline profiles and the last one is declining more rapidly. You can also export out all of these values to further manipulate in Excel or anywhere else.
Conclusion
That about covers the well level decline analysis. As you can see, it is a very quick and easy way to generate declines on any well.