WellDatabase is an extremely powerful, yet easy to use system. This is accomplished by keeping our base options simple, but also allow you to customize your experience. One of the simple toggles we have is our well browser views. These toggles allow you to turn the Map, List, & Analytics on or off. Here's a very quick rundown on how you do it.
On the top-right of the screen, you'll see 3 buttons aptly named Map, List, & Analytics.
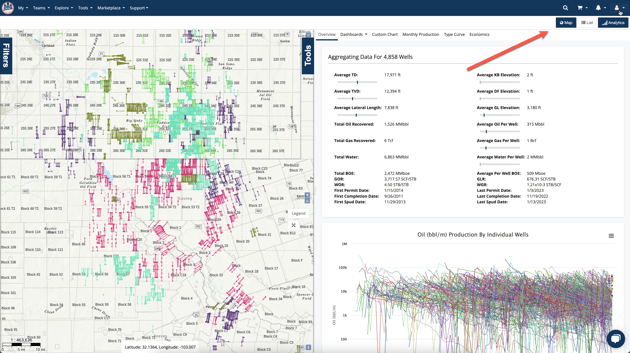
The default view is to have the Map & Analytics on. This works well as the analytics will interact with the map spots.
Toggling on the List view shows the Headers by default. You can use the List view to export data as well.
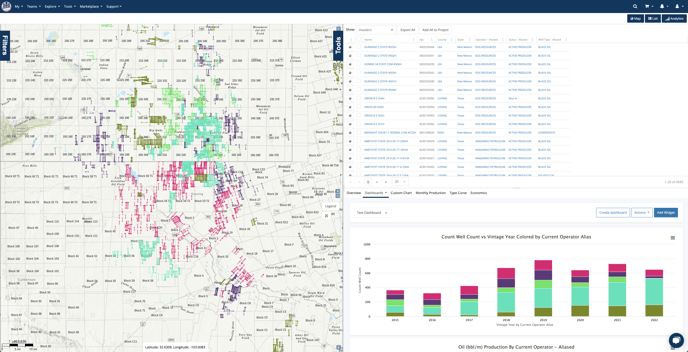
For more info on the List view, see the following articles:
You can also turn off everything but the map if you're doing more detailed GIS. Simply click the List and Analytics buttons and you get a large mapping area. Full screen maps allow for multiple layers to be better visualized like below.
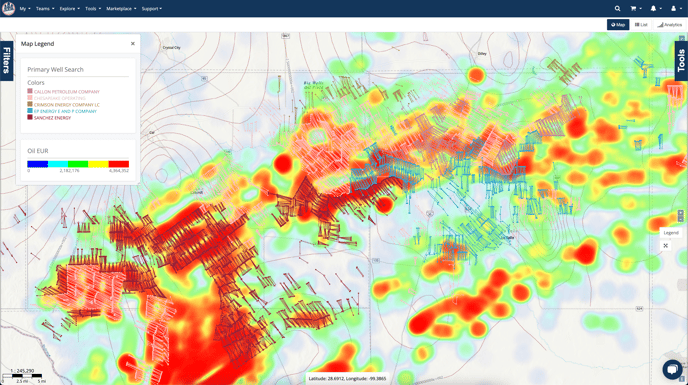 This map contains county lines, Oil EUR heatmap, and well spots colored by current operator.
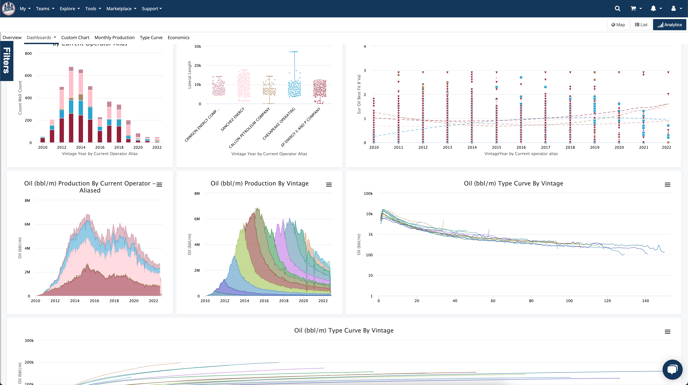
Another option is to go full screen with the analytics. This can be especially useful when viewing a large and complex dashboard.
As you can see, the simple toggle for the Map, List, & Analytics gives you a customizable experience without being complicated.