How do I export charts from WellDatabase?
Want to pull out a chart from WellDatabase to throw into your presentation or email? Not a problem. Here is a quick guide on getting it done.
If you can create a chart in WellDatabase, you can export it. Not only can you export the images, but you can export the data behind the chart as well. Here’s a quick rundown of the ways you can use that data.
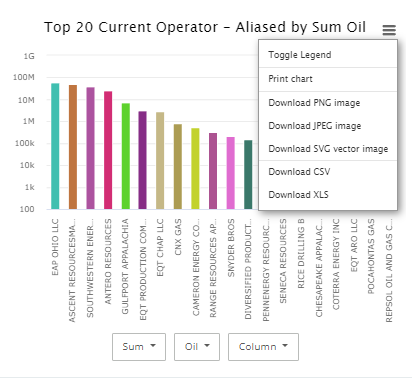
First, to export data from any chart, you simply need to click on the menu icon in the top corner of the chart.

The options there are pretty clear. Simple print, PNG & JPEG image, CSV file, and XLS.
Another interesting use of exporting in this manner is the ability to export a set of wells with production by month number. This is a common workflow when doing decline curve analysis
Conclusion
Exporting data from WellDatabase charts is a great way to extract both data and visuals out of WellDatabase.