What are the decline curve settings?
Decline curves are easy to make in WellDatabase. Here is a breakdown of the options available to you.
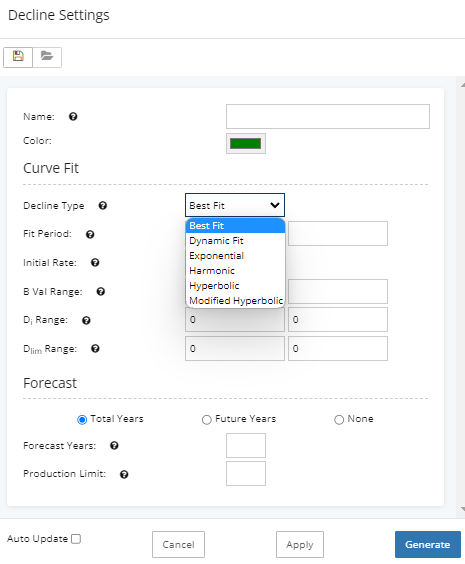
While there are several places you can generate decline curves, the menu options to do so are the same. Here is what we’re looking at.

So a run down on the options here
- Save/Open – You can save your decline settings and recall them at any time.
- Name – You can create multiple declines on any data set, so naming can be helpful.
- Decline Type
- Best Fit – A mathematical best fit is generated from the data available. The data used in the best fit can be altered by zooming to the desired area on a production chart. Learn more about generating best fit declines.
- Dynamic Fit – Best fit is automatically created every time you change your data set. The period specified will be used to generate a best fit model based on the data in your search.
- Hyperbolic
- Harmonic
- Exponential
- Modified Hyperbolic
- Fit Period – Date or month number range used to determine fit. Production outside of the period will not be used in determining fit.
- Initial Rate – Initial producing rate. Will default to the peak value available in the data set.
- B Val Range – Only available when using best fit. Set a lower and upper limit on b value used in the fit.
- B Val – Only available when using hyperbolic. Specify the b value you want to use for the decline curve.
- Di Range (Initial Decline) – Only available when using best fit. Set a lower and upper limit on the initial decline. Initial decline is calculated as a part of the best fit.
- Dlim Range (Terminal Decline) – Only available when using best fit. Set a lower and upper limit on the terminal decline to fit.
- Forecasting Production Limit – Forecast production into the future until values hit the monthly rate specified in this field.
- Forecasting Years (total or future) – Forecast production to a set number of years. The years can be total years from start date or future years from end date.