Type curves are one thing, but there are a number of times when you want to strictly decline an operator’s current production. This task requires a little more attention to detail, but WellDatabase can help you walk through it.
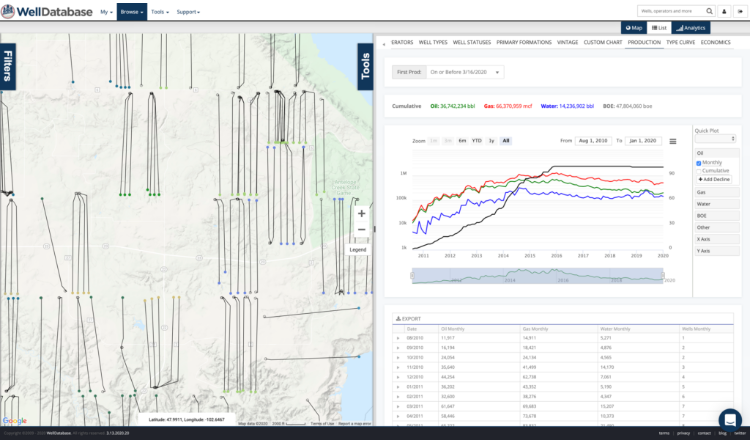
To start our example, we’ll zoom into an area. Then we’ll apply a filter to exclude the more recent wells. This helps us establish a declinable range of data. If you attempt to decline production using a simple best fit with wells producing less than 6 months, your results will likely be skewed.
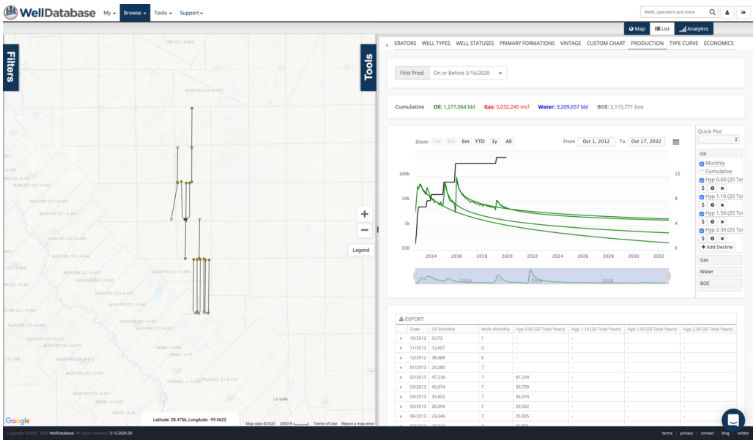
You can see in the image below that the well count (black line) flattens out in 2016.
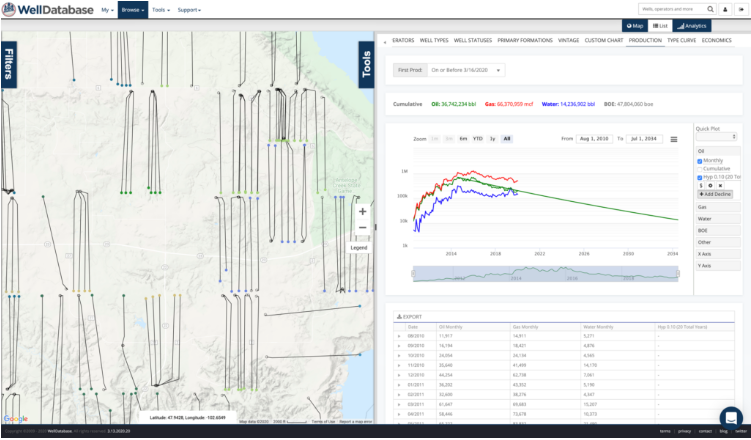
Now we can actually just apply a decline to this set. The best fit will identify the max production month and create a best fit on the months afterwards. To read more on creating a decline, read our Decline Curve Settings article. Here is what we get.
So it’s not bad, but you might say that those last couple months are throwing off the fit. No problem, we’ll zoom in and exclude those months and generate a second decline. To learn more about creating multiple declines, see this article.
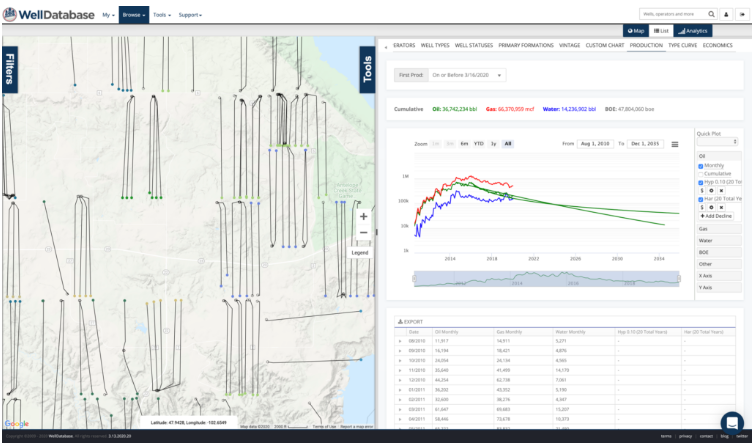
Of course it is open to interpretation, but I think we like this new decline better. Now we can use the same date range to create the gas and water decline curves.
Like always, you can export this data. You can also note the parameters and utilize those on future decline curves you create.
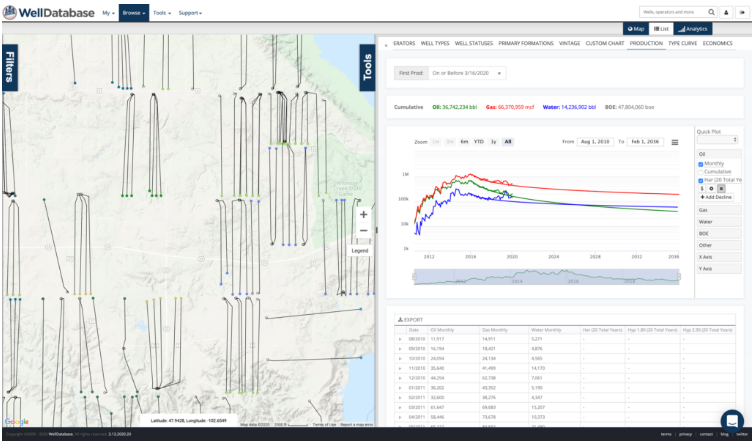
Another great use is to compare the declines and effect on lease level production as wells are brought online. The well count series helps us identify the time frames where the new wells are coming on. Then you can decline each set and compare like below.
Learn more about decline curves in the following articles:
- What are the decline curve settings?
- How do I create a decline curve on a single well?
- Can I compare multiple decline curves?
If you prefer a visual demonstration of how to create decline curves, we have a dedicated YouTube video that you can watch. In this video, we walk you through the process step by step, showing you how to apply filters, establish a declinable range of data, and create decline curves using the best fit method. This video provides a clear and comprehensive guide that can help you better understand and implement decline curves in your analysis. So if you're a visual learner or simply prefer watching a demonstration, be sure to check out our YouTube video on decline curves.