Using the overlay for a data layer allows users to compare two datasets that are not directly related, with only the search filtered attributes visible in analytics.
To help explain data layers, let's walk through an example.
Use Case
Compare 5 mid-size operators in the Anadarko basin to Chesapeake to visually see how the mid’s offset the Chesapeake wells and then only show analytics for the mid-size companies.
Since Chesapeake has such a large stake in the Anadarko basin, including this company in the search analytics – their numbers over power any other operators analytics charts. We want to see their well placement in comparison to 5 mid-size companies, we will add a data layer for Chesapeake so they appear on the map but not in the analytics.
Adding the Data Layer:
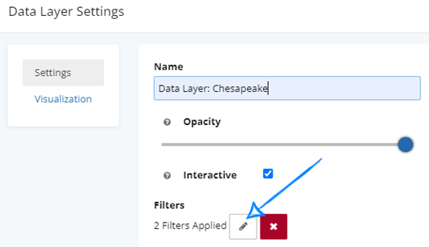
Tools> Layers + > Data Layers> Assign a Unique Name> Edit
Clicking the edit pencil will open the applied filters screen and give a summary of which filters are currently applied. Remove any unwanted applied filters.
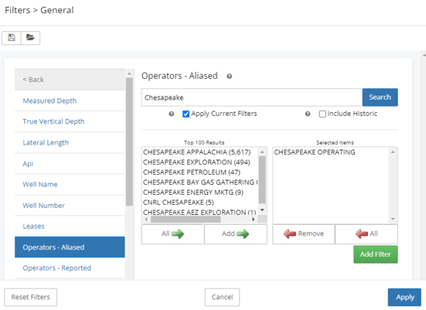
Filters> General> Operators-Aliased
After selecting Operators-Aliased, search for the desired company and click add. Once the company appears in the selected items, click add filter.
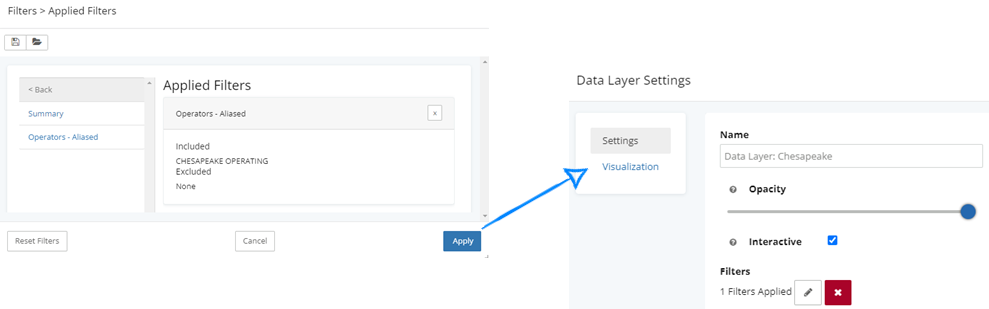
Once the correct filters appear in the applied filters, click apply and the Data Layer Settings screen will pop up.
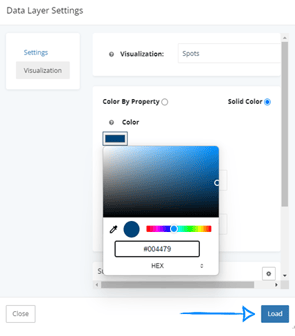
Before we complete this task and load the filter, we will normalize the color to make these wells standout as their own entity, by clicking the visualization tab.
For this data layer, we want to show all of Chesapeake’s wells as one color regardless of the type of well. Choose solid color – and then edit the color. Selected below is the HEX code for Chesapeake’s blue. Size and shape of the well spots can be edited using the additional filters, but for this example – we only adjusted the color. Once the setting is correct – click load.
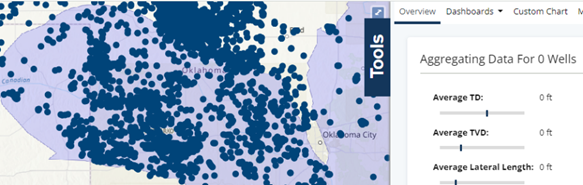
Now that the data layer has been applied, the well spots are on the map in the color we selected, however, the analytics are not picking up any wells in the search area. Which is what we want when using this method of data layers versus the search filters.
Applying the Search Filters:
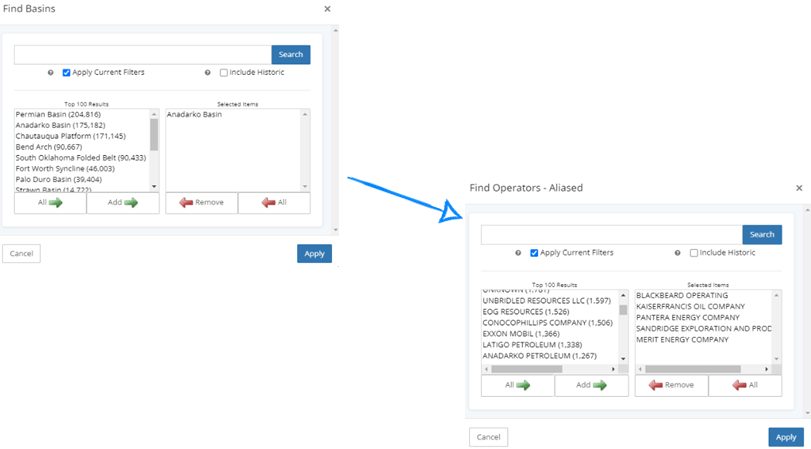
Filters> Geographic> Basins> Select Anadarko> Add> Apply
Add Anadarko basin and click apply. Repeat to select the mid-size operators.
Filters> General> Operators – Aliased> Select Operators> Add> Apply
Select the mid-size operators to include.
The Results:
The legend below shows the companies from the primary search – which analytics are aggregating data for, as well as the data layer that we added for Chesapeake.
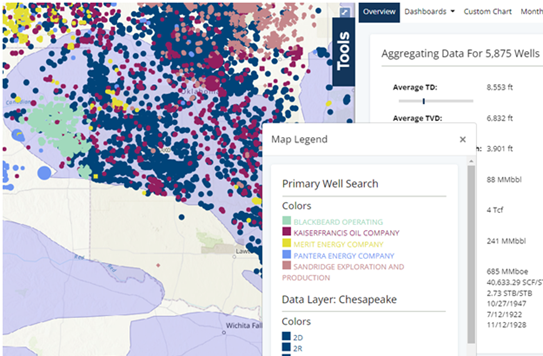
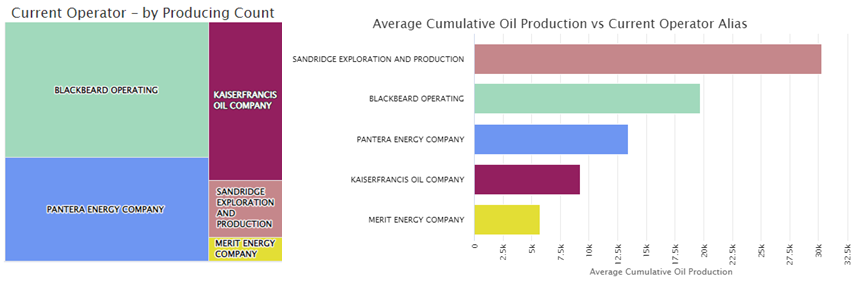
While visually we can see Chesapeake on the map, their data will not apply to any of the analytics. All dashboards will be reporting only on data from the 5 selected companies creating an easier comparison of these companies.
If you're interested in learning more about data layers and want to explore the topic further, we have a collection of additional articles and blog posts available. These will provide you with more insights into the concept of data layers.