To get to any of these settings, go to the map tools panel.
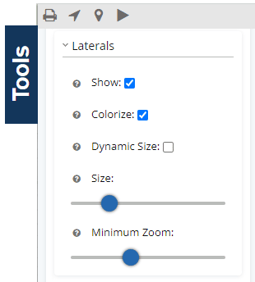
- Show – Simple toggle to hide/show the laterals on the map. Keep in mind that showing the laterals will also respect the Minimum Zoom setting at the bottom.
- Colorize – Toggle to color the laterals. This color will be defined by the Color By selection in the group settings.
- Dynamic Size – Toggle to define whether the size (thickness) of the lateral line is static (using the size chosen) or dynamic (sized based on the Size By property in the group settings).
- Size – Thickness of the line used to show the lateral. If Dynamic Size is not selected, this value with represent the thickness in pixels used to draw the later. If Dynamic Size is selected, this is the base size for the smallest possible value (again, based on the Size By property in the group settings). Larger values will result in a thicker line.
- Minimum Zoom – The minimum zoom will show/hide the laterals based on your zoom level. Lower values mean the laterals will be show when zoomed further out. Higher values will restrict the visibility until you are zoomed in closer. This setting is valuable to ensure that you can always have a clean looking map.
To learn more about Group settings, view the following article:
If you get an empty map when you shouldn't - check that you zoom level isn't set too high. This can be a common problem, especially if you are only showing laterals. (no bottom hole or surface hole).