The settings can be controlled in the map tools panel under the Group Settings section.
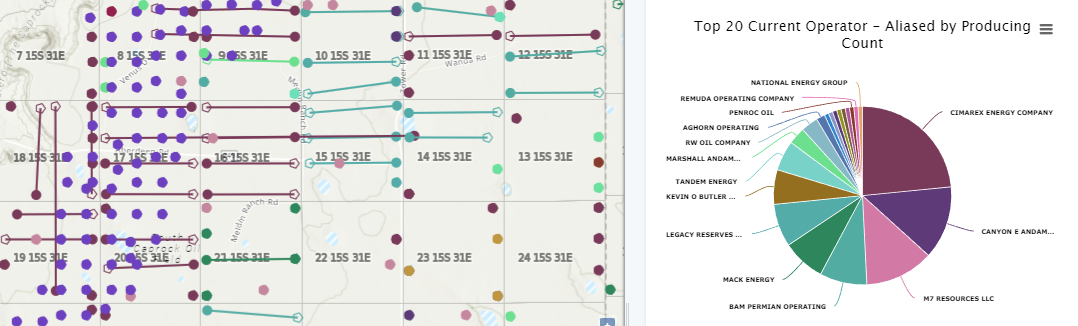
The Color By setting will assign colors to your map spots and laterals based on the property you select. This color will also correlate to the colors in the analytics, making for a seamless integration between the two sections.
Well Layer Settings Selected: Visualization type: Well Spots, Group Settings: Color by current operator for Surface hole, bottom hole, and lateral colored.
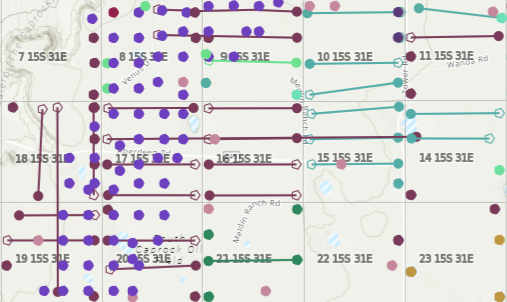
With analytics turned on, each operators unique color in the legend is the same for that operator in analytics.
Tip:
If the colors are too similar for operators, you have the ability to adjust the color of the well spots and analytics chart.
For more information on how to adjust the colors, check out: Can I change the color for an operators well spot?
Shape By
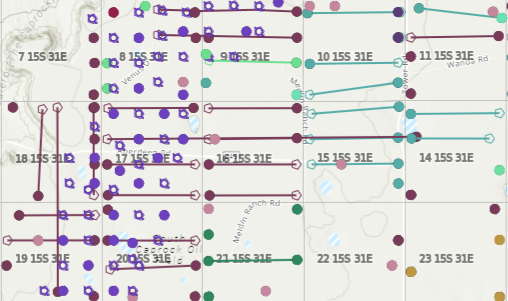
The Shape By setting lets you specify an additional property to set the shapes of the bottom hole spots on your map. Using it with the Color By gives you a more detailed breakdown in a single view.
Additional Settings: This example is using the same settings as above, but with the shape tied to well type.
Size By
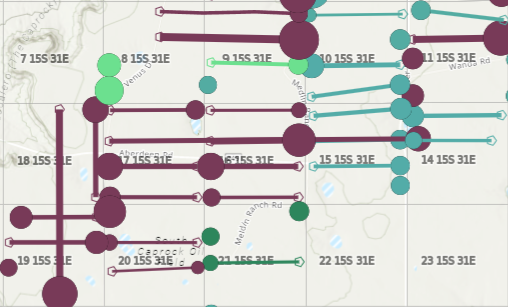
The Size By option lets you specify a property (mostly production related) to scale the size of the spots/laterals. You can choose which visualizations you want to be affected in the surface hole, bottom hole, and lateral settings.
Additional Settings: Then adding size by First Six Month BOE. The dynamic size is only enabled on the bottom hole.
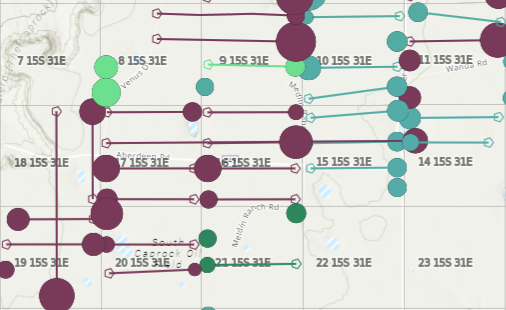
Additional Settings: Same as above but with sizing on the lateral and bottom hole.
There are countless options for setting up your map, so jump right in and start playing with it. You’ll see just how easy it is.