Here’s the main page of the rig report:
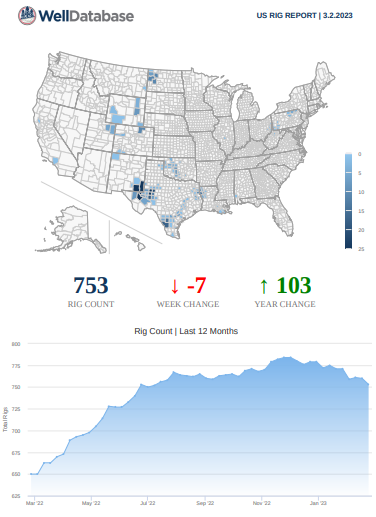
The map gives you the breakdown of rigs by county along with the counts and percent change below that. The chart at the bottom is the rig count over the past year.
Since the rig report is not related to a well or particular set of wells, it must be generated from My> Home > Quick Reports
Tip:
To receive this report via email, subscribe at My> Report Schedules
For more on accessing on-demand or report schedules, read: How can I access a system report?
If you prefer to access this information through Excel versus a PDF, here is another article that you may find helpful: Can I get a Rig Report in Excel?
What information does this report provide?
The cover page is shown above, but there are a number of additional pages with other looks at the rig activity.
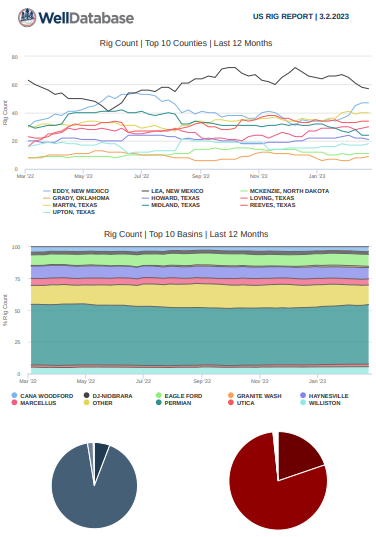
This page breaks down the activity over the past year by county and basin. At the bottom we see a couple of pie charts to give an idea of current rig targets.
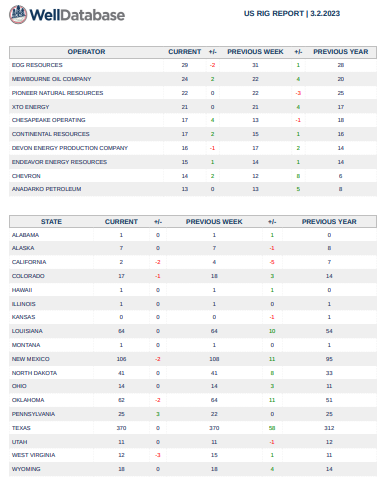
The next page starts a set of pages with different tabular views of the data. This page we get the breakdown by operator and state.
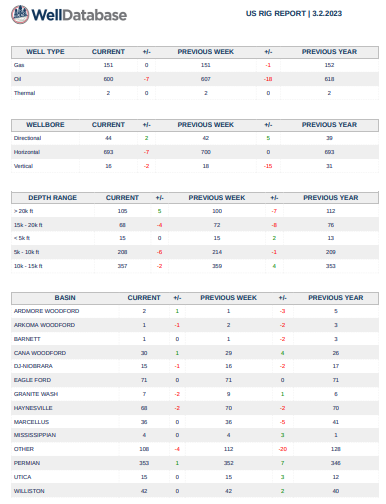
Then on the last page we get breakdowns by well type, wellbore profile, depth range, and basin.
The rig report is a great report to give you a high-level understanding of the current rig activity. Many of these views have been published in other locations at different times. Here you get them all in one neat package.