What are dashboards?
Visually analyze data and uncover insights in data trends through WellDatabase dashboards.
WellDatabase has two main types of analytics, event based and volume based. With the dashboards, allowing you dig into both types. Dashboards hold all of the reporting features in our system.
Event Based Analytics
Permits
Rigs
Completions
Stimulations
Tests
Volume Based Analytics
Production
Injection
Disposition
Choose your dashboard, and how to group the data:
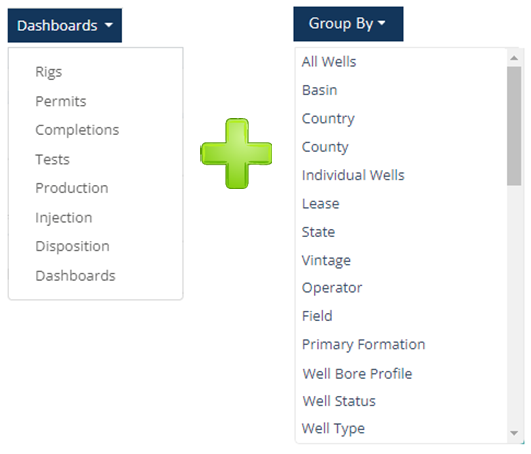
Inside some of the dashboards, there are “group by” options specific to that dashboard. These are the additional options specific to the permit dashboard and will not be found in any of the other dashboards.
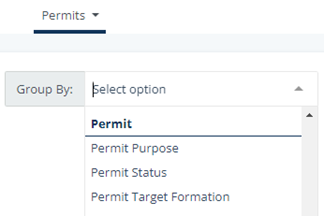
Examples:
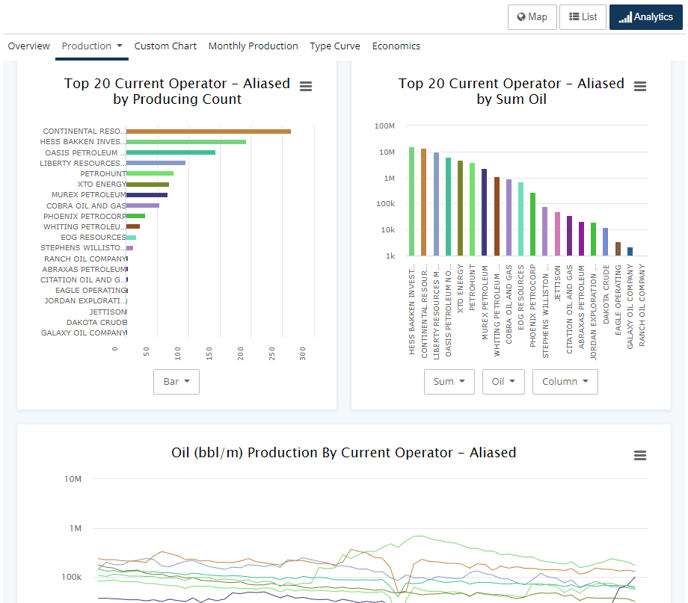
Production Dashboard
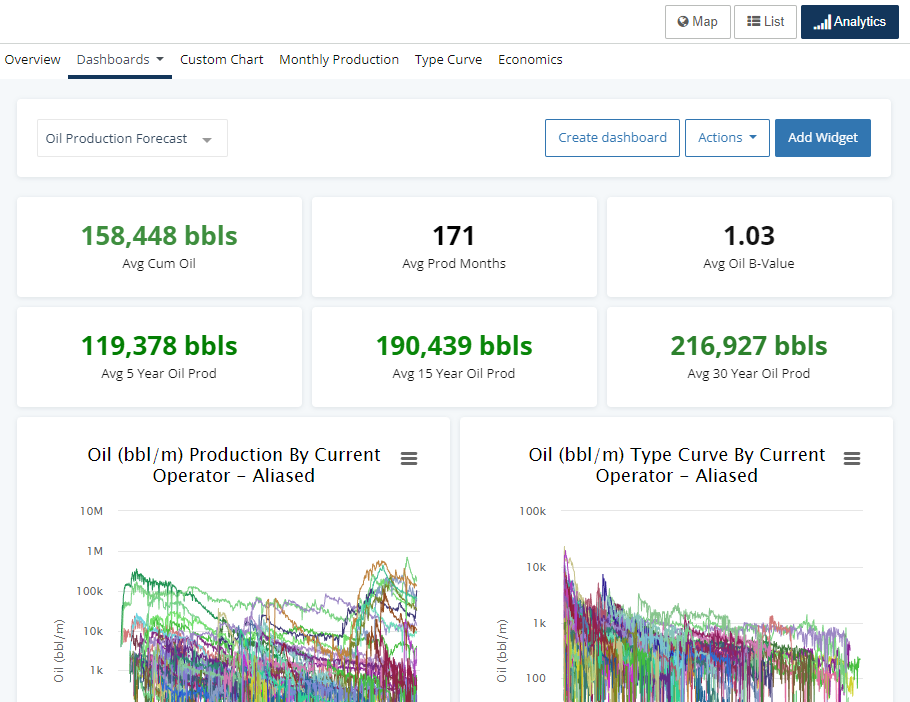
KPI Dashboard
Combining charts with KPI cards
We encourage you to look through all of the dashboards to discover the data that is pre-built and available to you. After that, feel free to build your own dashboard and customize your data exactly how you want it organized.
To learn more about creating a dashboard, read this article.