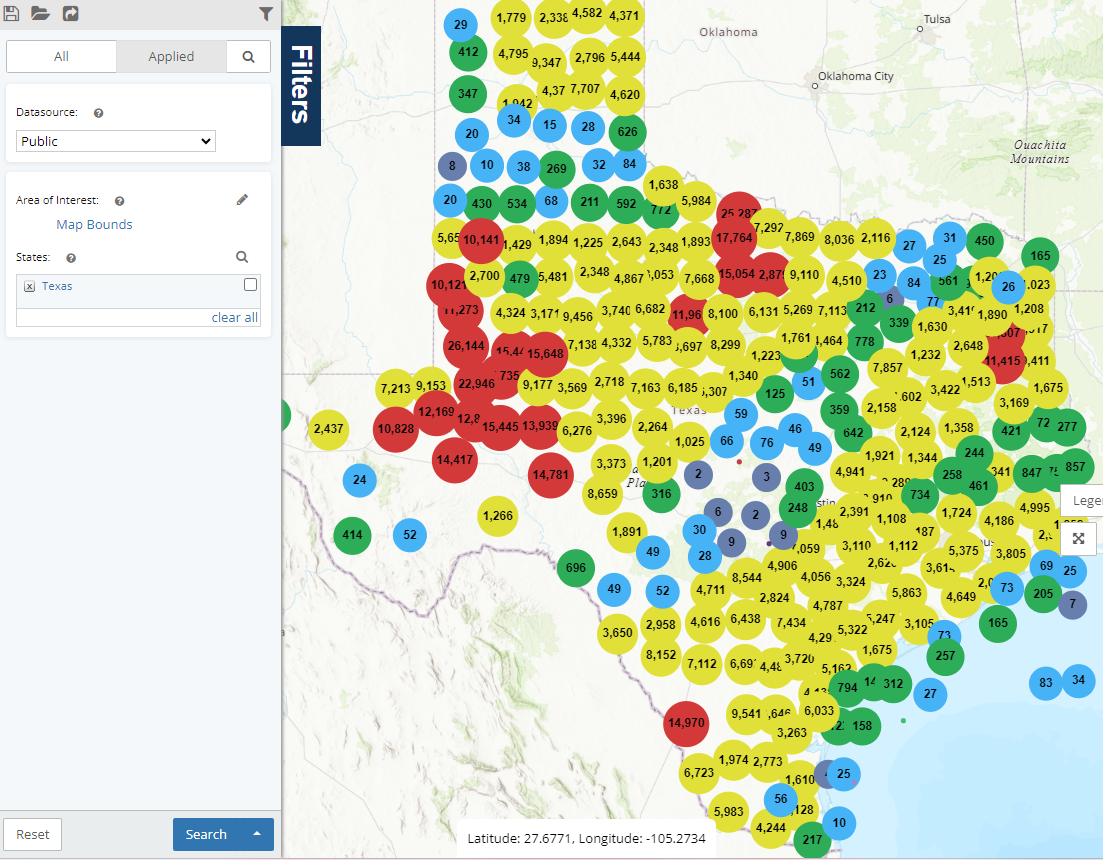
With just a few clicks, users can access completion metrics, providing valuable insights into the specific region of interest. This user-friendly functionality allows for quick decision-making and enhanced understanding of completion trends within the WellDatabase platform.
To get started, simply use the filters to narrow down the map results and display only the wells that are relevant to your area of interest. In this example, we will focus on examining completions in Texas.
Completions Dashboard
Next, navigate to the Analytics screen and select the Completions Dashboard. On this dashboard, you will find a variety of options to group the data by, such as County, which we will use in this example. To explore a comprehensive list of grouping options that are available, click here.
To refine the completions to a specific timeframe, simply utilize the data range located on the right side of the screen. This feature allows you to easily filter the results and view completions within your desired time period.
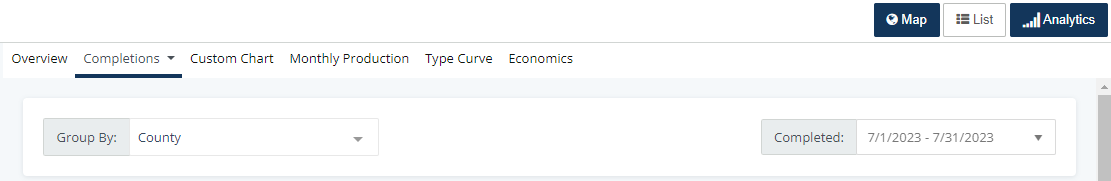
After you have chosen the grouping option and the specific date range you are interested in, the analytics will automatically update to reflect your selections.
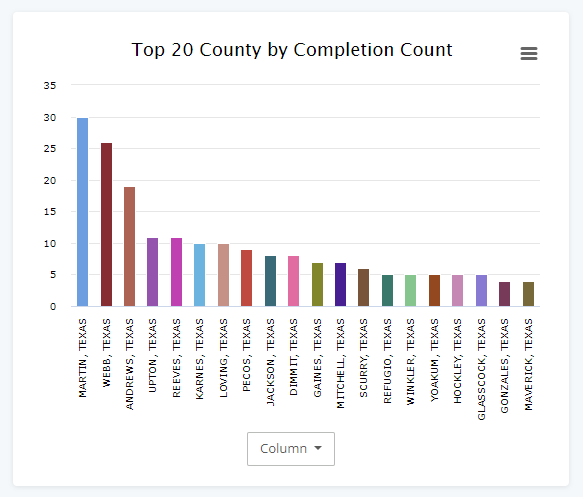
Completion Count Chart
By default, the completion count is displayed as a pie chart. However, you have the option to change it to a bar chart, column chart, or treemap. Since this example is focused on identifying counts, we recommend selecting the column chart. This will allow you to visually see the counts more clearly.
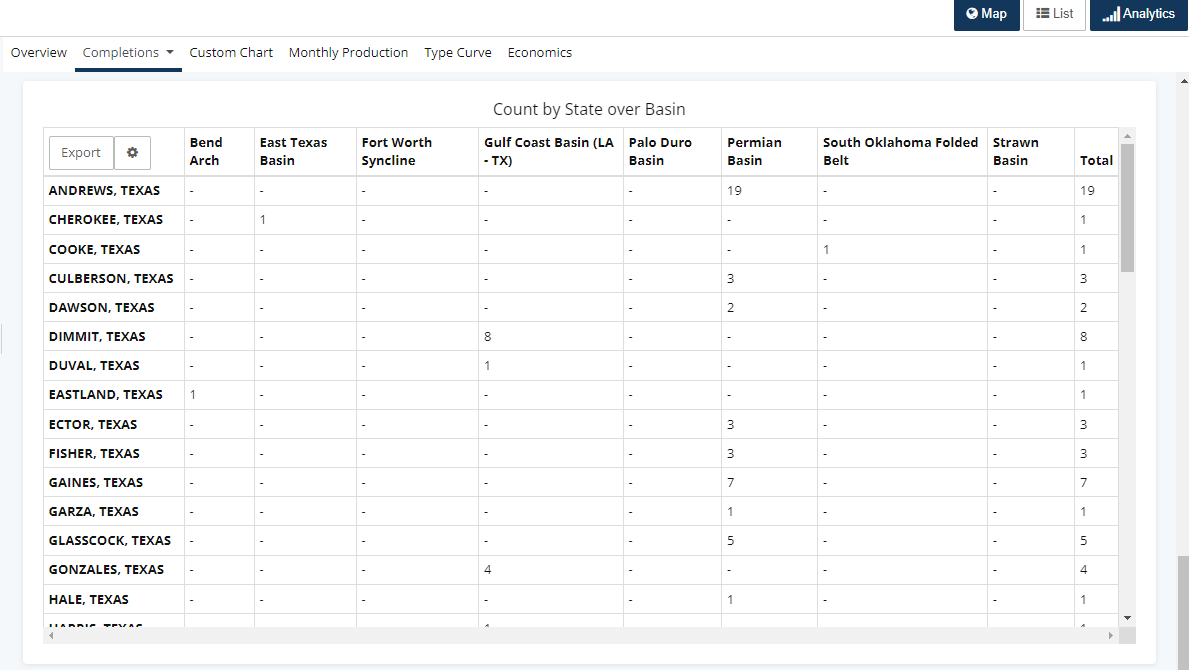
Completion Count Pivot Table
In our example of Texas wells grouped by county for a specific month, you can find an exportable list of completion counts by county over basins in the pivot table located at the bottom of the dashboard. This valuable tool allows you to easily analyze and export the data for further analysis or reporting purposes.