This is by far the easiest way to get started. Simply zoom in on the area of interest and you will notice that the well count in the analytics will reflect the wells visible on your map.
Here is a quick example of using the map bounds to filter wells.
With Map Bounds as the only filter applied, the analytics tab is aggregating data for over 5 million wells.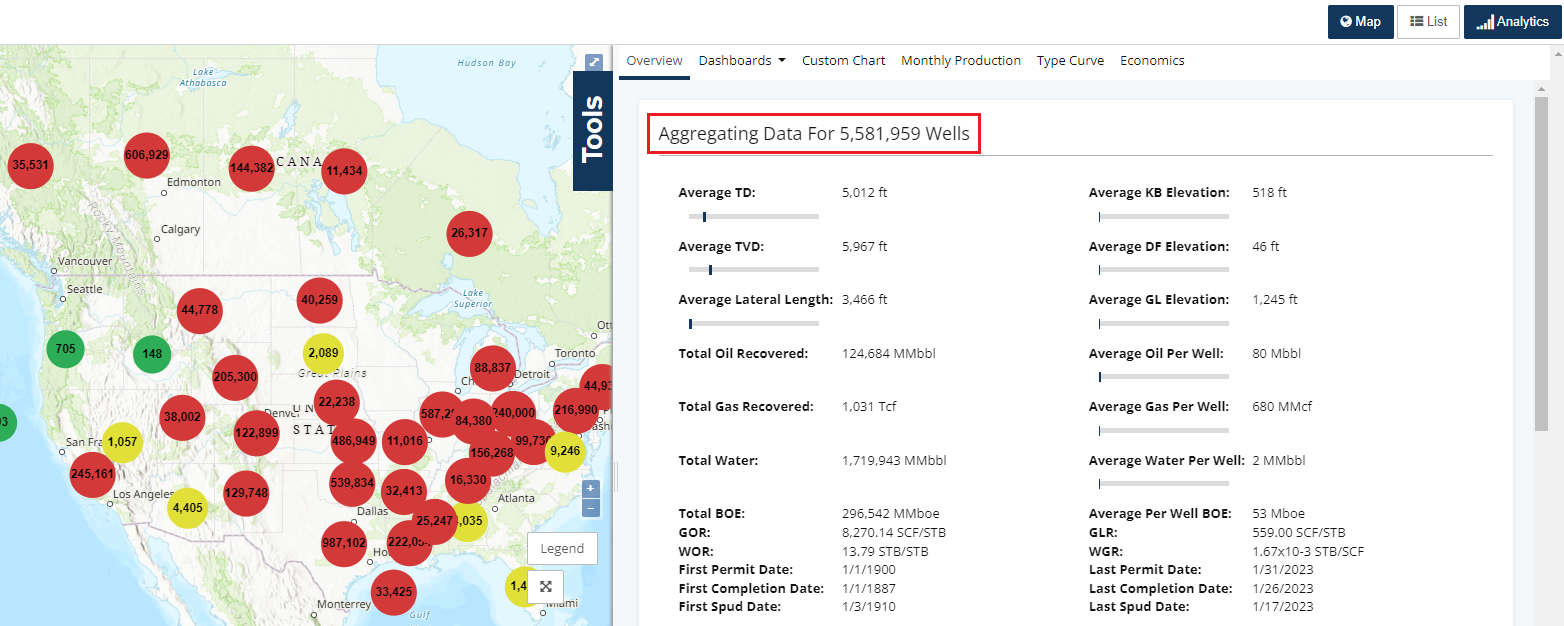
By scrolling to zoom over the map, you can see that by narrowing the map view to a handful of states, changes the number of wells that analytics is aggregating data for.
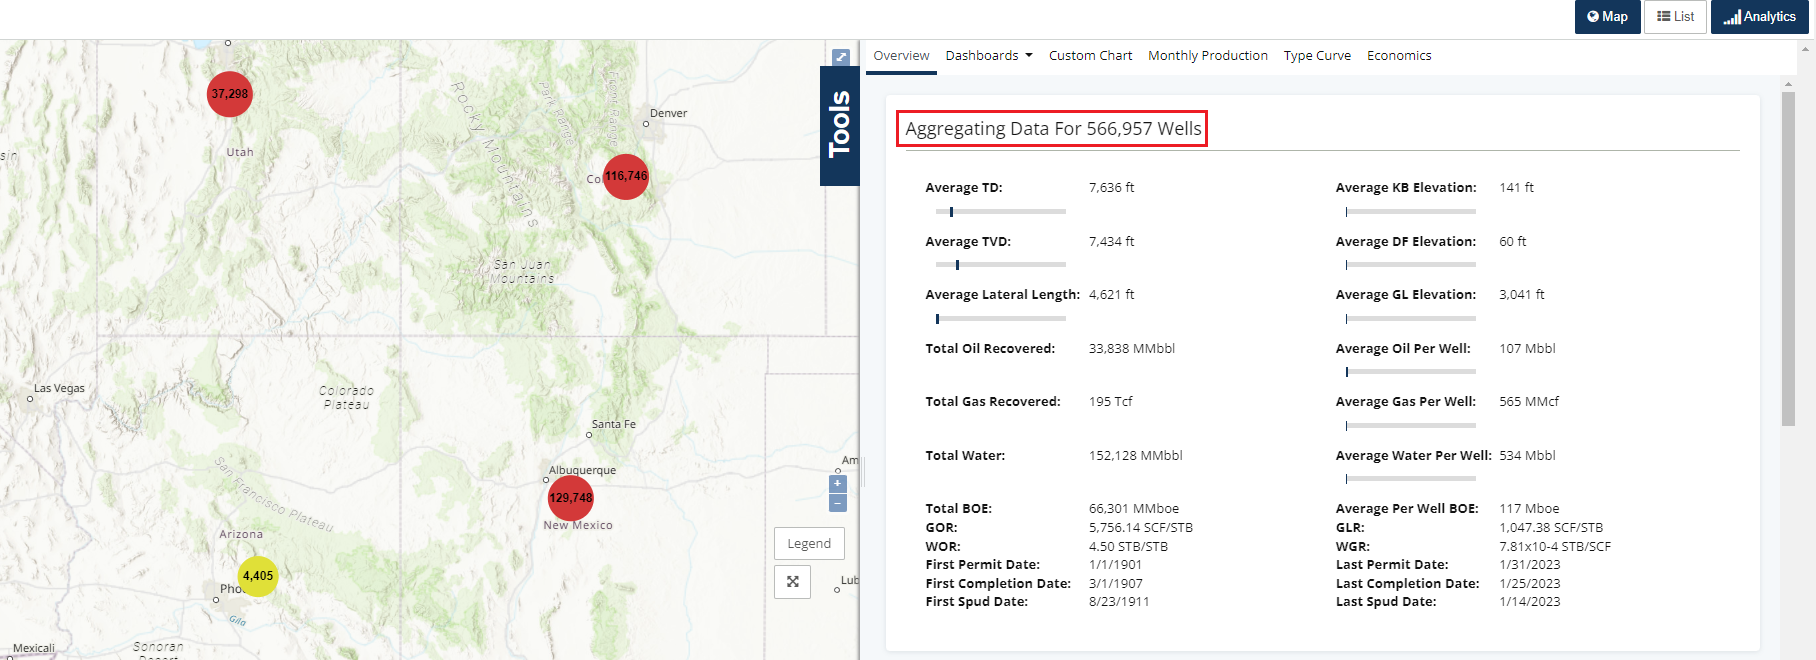
Now let's zoom into New Mexico.
Note: Since we are not using the search filters to select New Mexico, some wells from outlying states will appear in the search resulting in 194k total wells aggregating data versus the 129k the previous map showed on the clustered well spot for New Mexico.
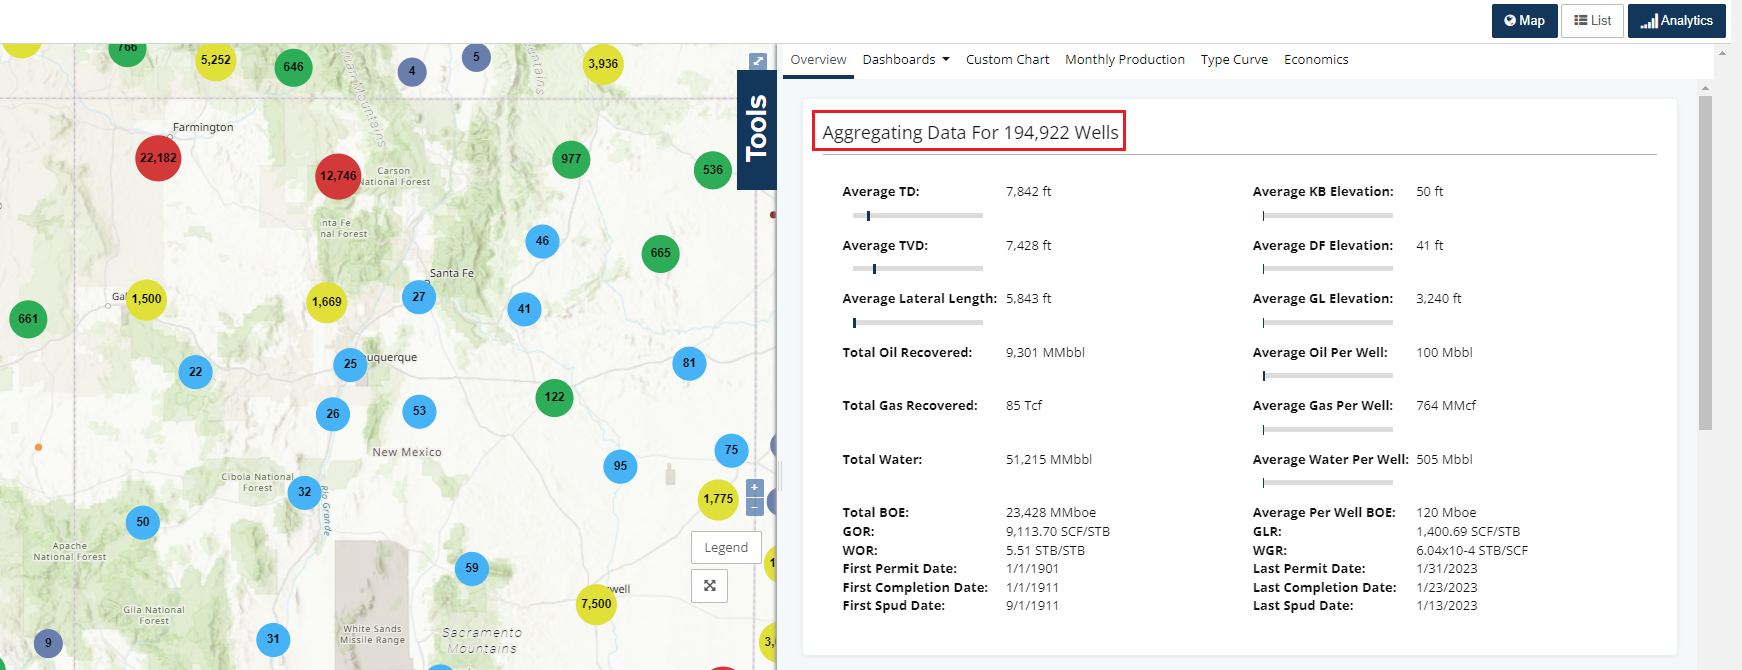
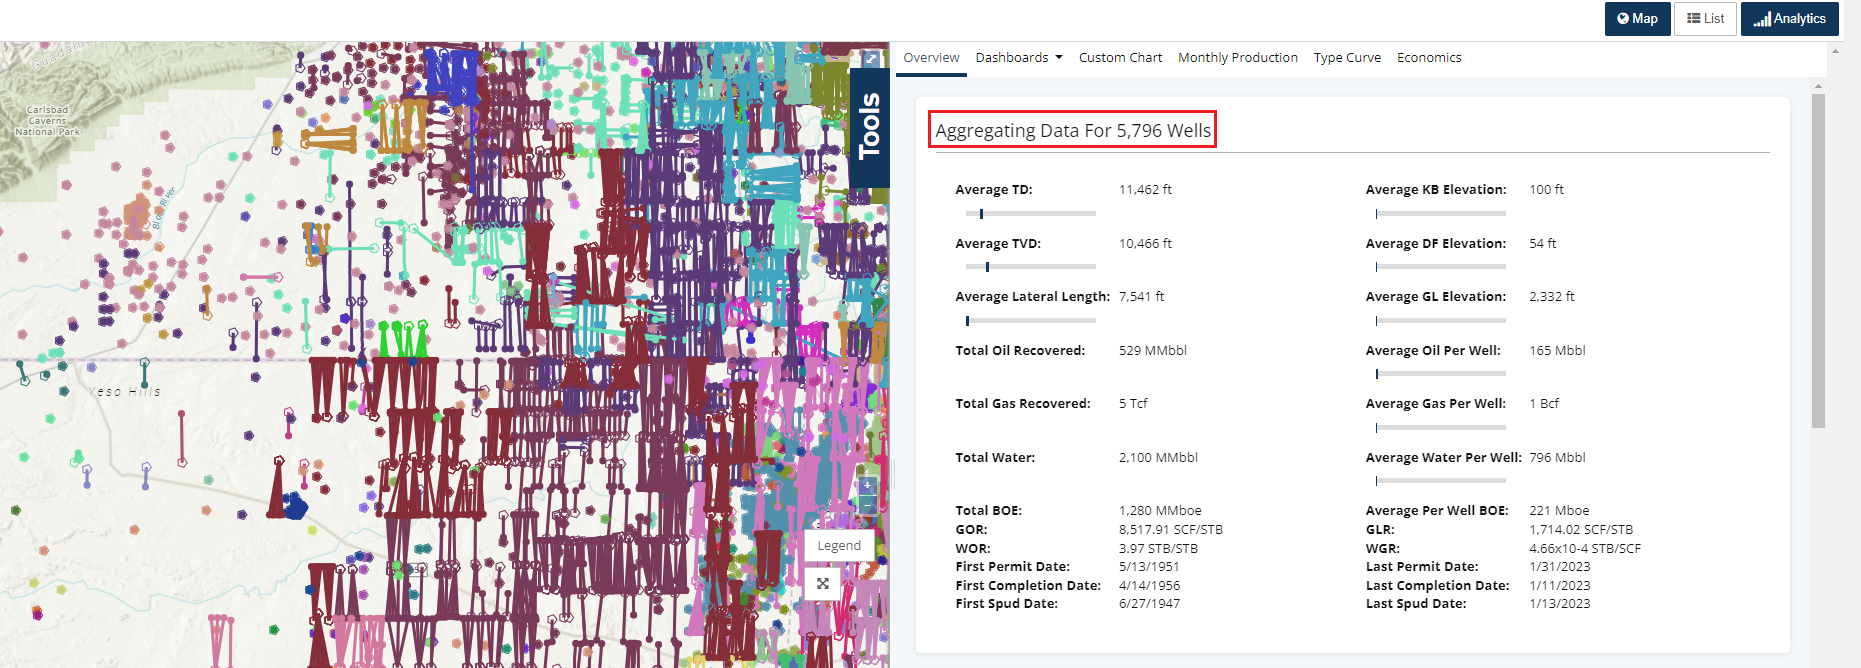
Zooming in closer to Carlsbad, New Mexico we now start seeing well spots instead of clustered spots. This happens once less than 50,000 wells appear in the active map view.
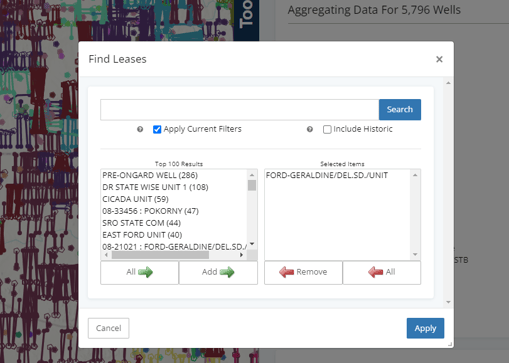
Search filters also work with Map Bounds. Once a new filter is added, since Map Bounds is turned on, the map will zoom directly to the results.
Below we added a search filter to add a lease within our search above.
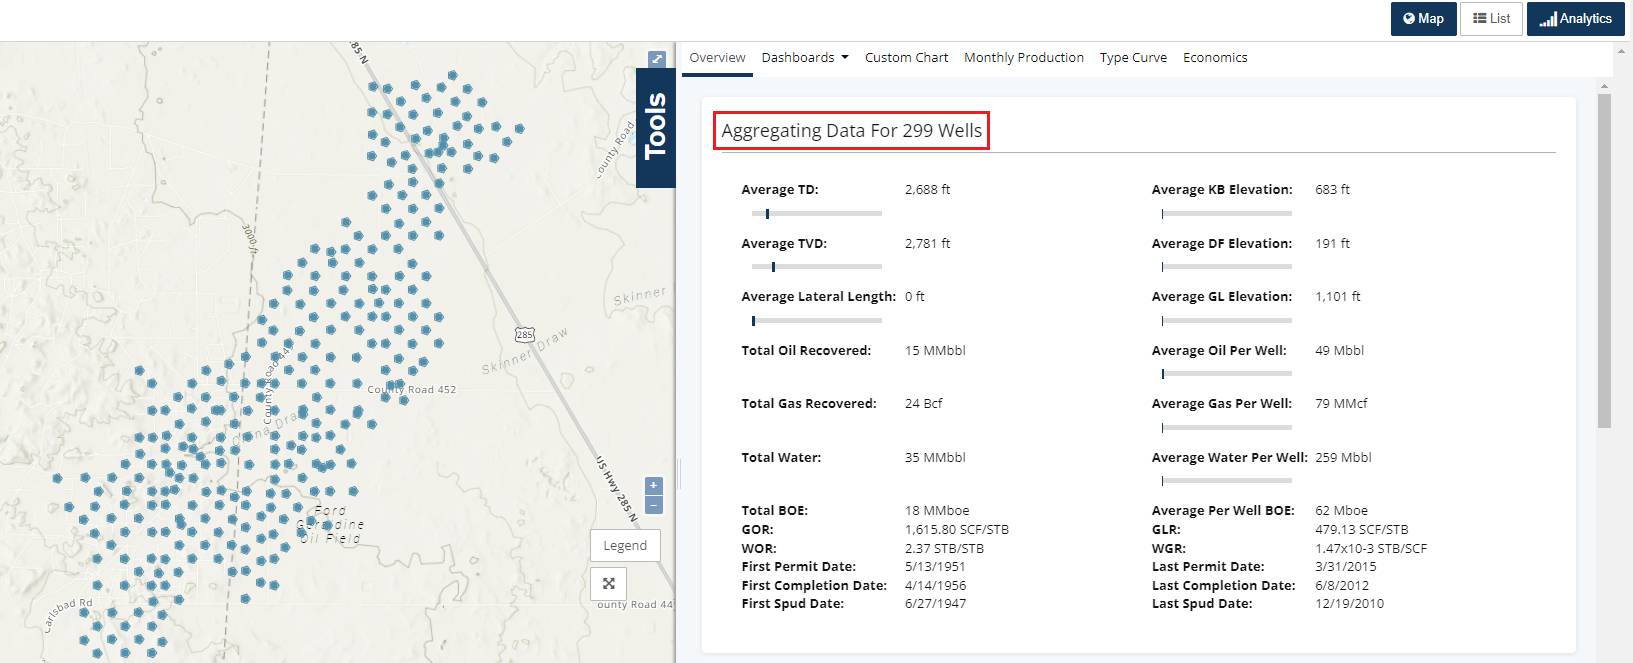
Once you click apply - the Map will be zoomed to the map view of the wells within the selected lease. The analytics will also update to only these wells.
Maps Bounds works together with any search filters applied updating the map view to results of the search filter.