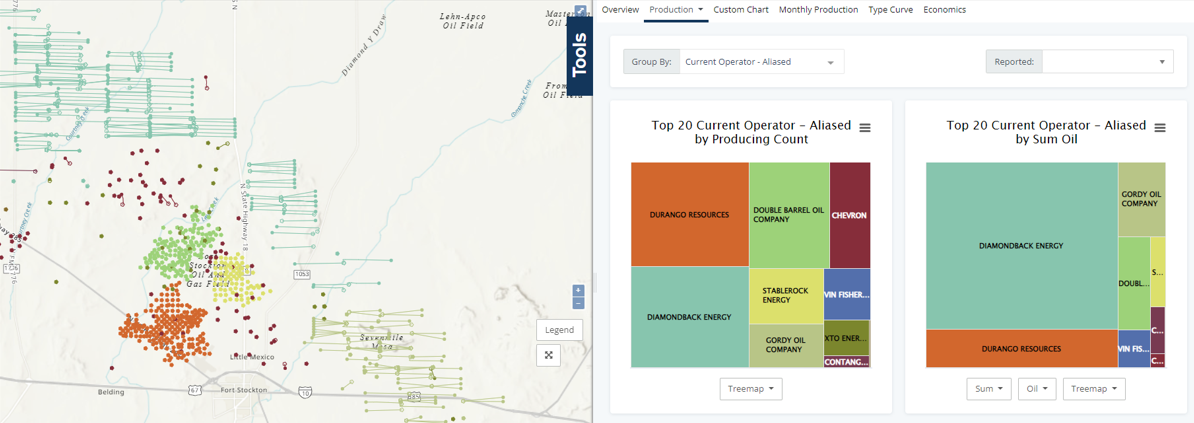
Treemaps offer a more abstract approach to analyzing data and can be incredibly useful in various business scenarios, such as analysis and reporting high-level information. With just a quick glance, you can easily identify the largest contributing values.
Now let's explore how these charts can help us make quick comparisons. In this scenario, we are focusing on the top 10 producers in this area. By comparing the treemaps side by side, we can easily identify that Durango, Diamondback, and Double Barrel have the highest number of wells producing. However, when we consider the total oil production from this set of wells, Diamondback stands out from the others with most of the production in this area.
Additionally, by utilizing the same set of wells, we have the option to switch our dashboard to Permits. This allows us to quickly gain the same high-level insight into the permit activity associated with these wells.
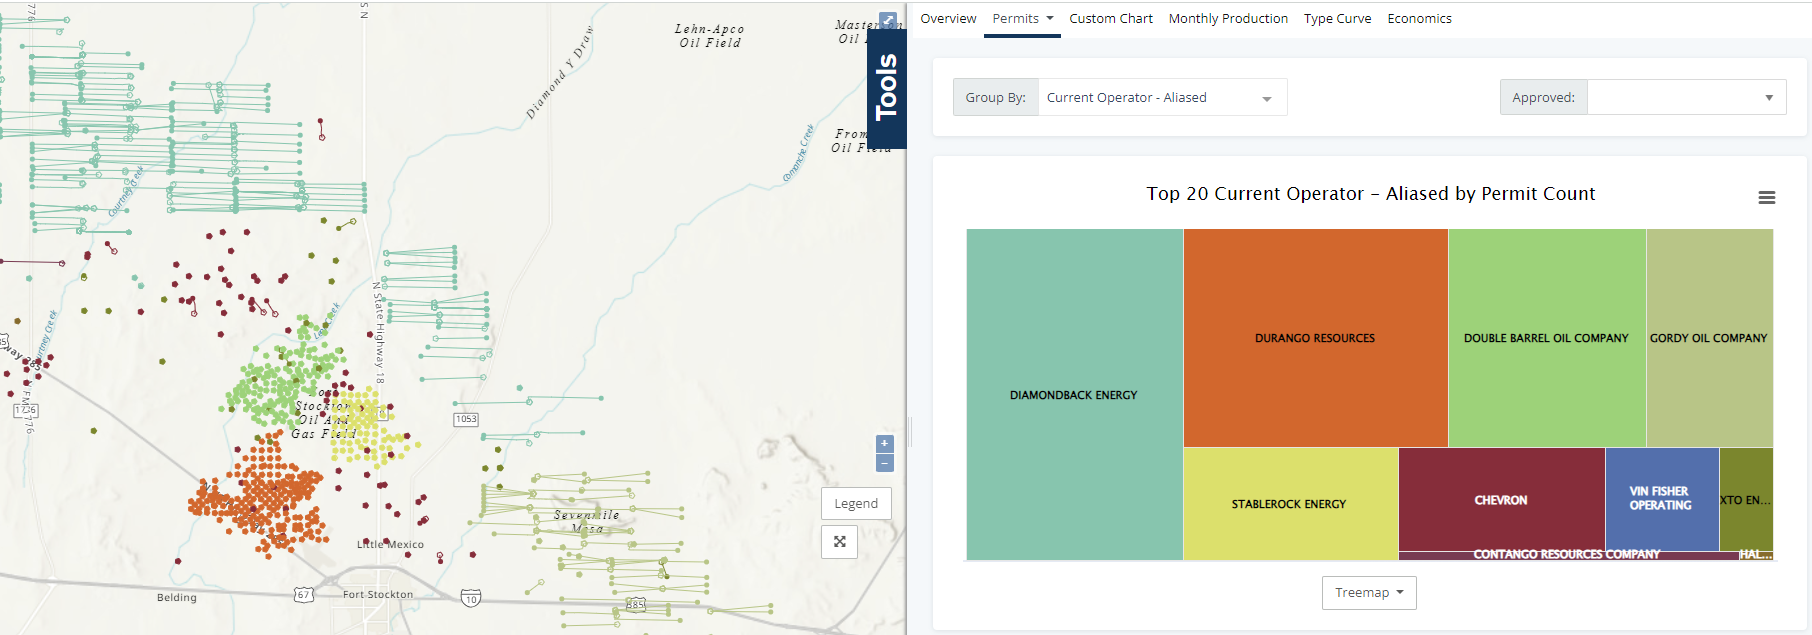
While treemap charts may not be suitable for every scenario, they offer an alternative method for displaying relational values and allow for a more abstract approach to data visualization.