The Well browser allows you to view mapping, well lists, and production analytics for searches you create in WellDatabase. You can customize the browser layout to show the panels that are most useful for your workflow.
How to Access the Browser
Go to app.welldatabase.com and log in to your account. Depending on your account settings, WellDatabase may open to the Home screen after login.
To open the Well Browser, go to Explore → Wells.
How Panel Toggles Work
The map, list, and analytics panels may or may not already be visible depending on your previous session settings. Use the Map, List, and Analytics buttons in the top-right corner to show or hide each panel. Blue buttons indicate the panel is visible, while white buttons indicate the panel is hidden.![]()
Layout Example
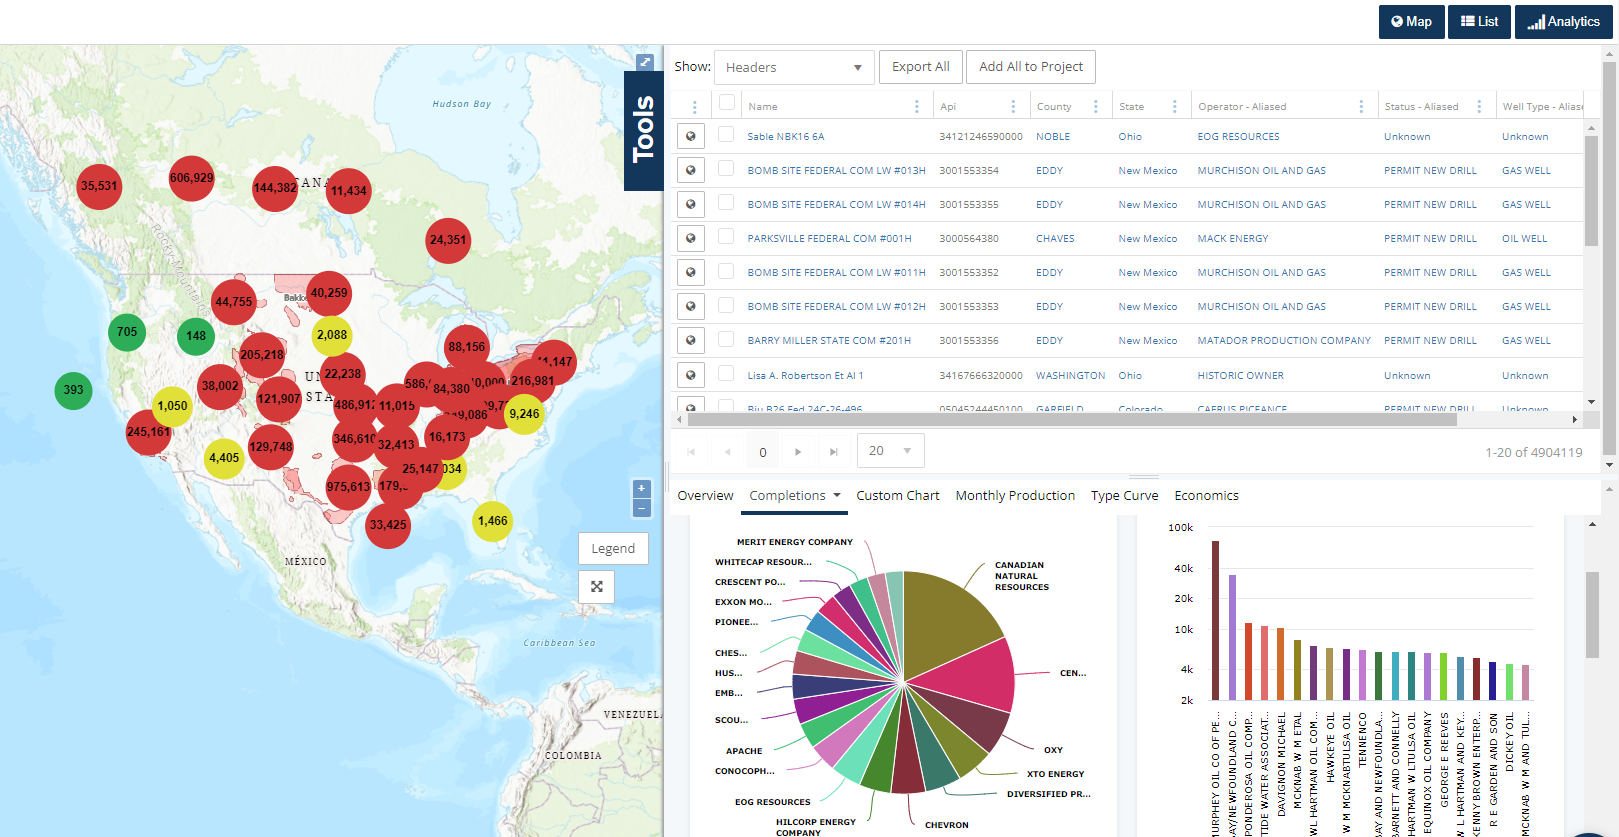
You can configure the Well Browser to display maps, lists, analytics, or a combination of panels depending on your workflow.
When multiple panels are visible, the panels remain linked. Updates made in one panel automatically refresh the related panels.
The example below shows all three panels enabled.
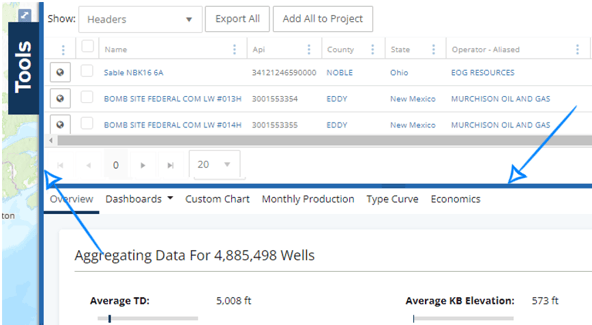
Resize Browser Panels
To resize the map, list, or analytics panels, click and drag the blue divider bar between the views.
Apply Filters to Your Results
You can apply filters to narrow results by operator, basin, API/UWI, production volume, permit date, and additional criteria available throughout the filters panel.
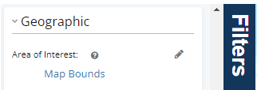
When Map Bounds is selected as the area of interest from the filters panel, the well list and analytics reflect the wells currently displayed in the map view. As you zoom or move the map, the related panels automatically refresh to match the visible area.
Frequently Asked Questions
Q: Why do the analytics change when I zoom the map?
A: If Map Bounds is selected as the area of interest, the analytics and well list update based on the wells currently visible in the map view.
Q: Can I hide parts of the well browser screen?
A: Yes. Use the Map, List, and Analytics buttons in the top-right corner of the browser to show or hide each panel.
Q: Are the map, list, and analytics views connected?
A: Yes. When multiple panels are enabled, the views remain linked. Changes made in one panel update the related panels automatically.
Q: Can I filter wells by operator, basin, or production dates?
A: Yes. The filters panel includes options for operators, basins, production volumes, permit dates, well status, geographic filters, and additional criteria.
Explore additional articles by searching the topics on the left. If you have any questions, feel free to email support@welldatabase.com