The event chart is a simple, yet powerful tool to help you better understand activity. Here is a very quick rundown of what you can do with the event chart.
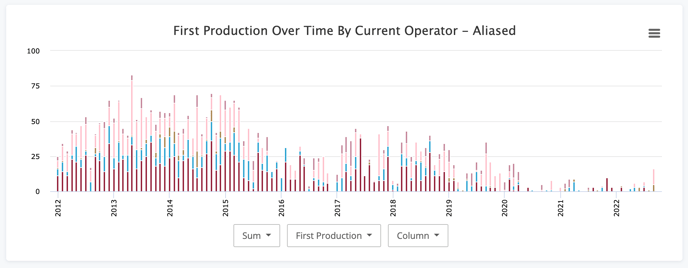
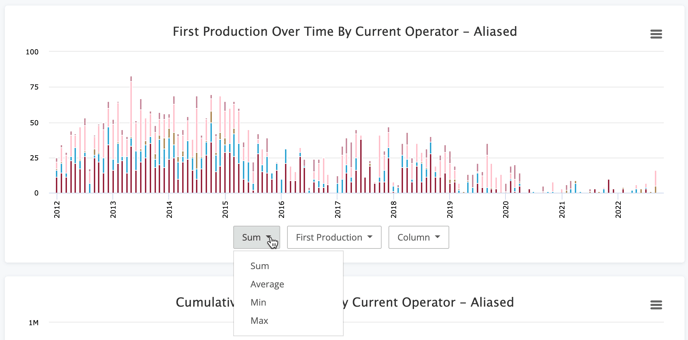
Aggregate Options
The first customization you can do is select the aggregation type.
Date to Plot
The next option you have is the date you wish to plot.
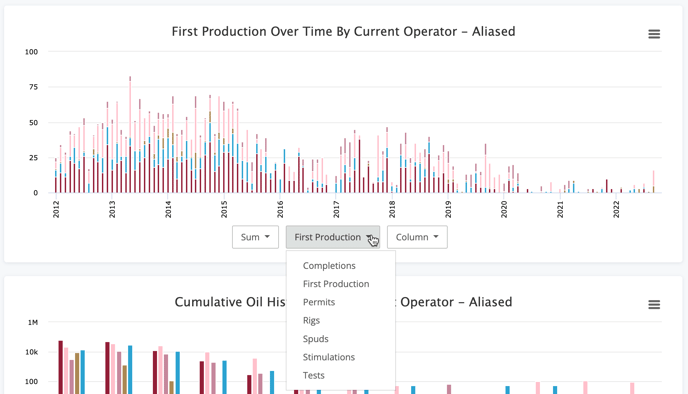
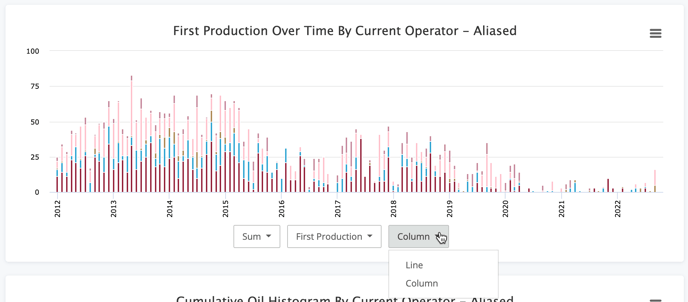
Chart Type
Given the simplicity of this type of data, the chart types offered are limited today.
Conclusion
The event chart helps you identify trends over time easily. Keep in mind that some of the best insights come from looking at different groupings and plotting the events over time. An example would be looking at Spud Dates while grouped by production Vintage. This would give you a look at the typical time between when wells are spud to when they are permitted.