Daily production values in WellDatabase allow you to view production as barrels per day (bbl/d), gas per day (Mcf/d), or water per day (bbl/d) instead of monthly totals.
Because most state agencies report production monthly, WellDatabase calculates daily production values by dividing monthly volumes by the number of producing days in that month.
This gives users a quick way to compare well performance on a normalized per-day basis.
Overview / Production Dashboard
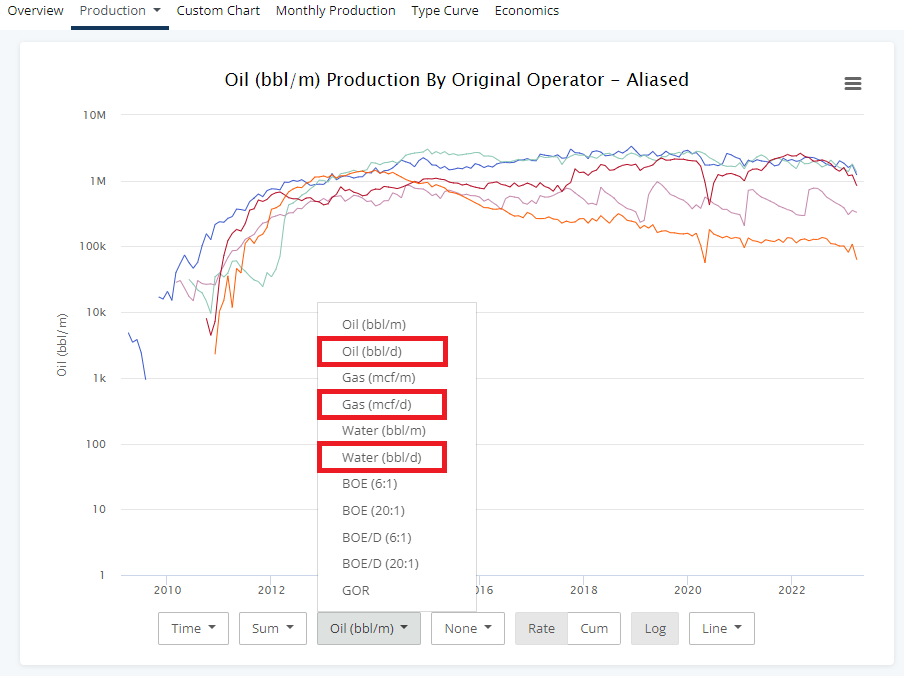
1. Navigate to the Overview or Production Dashboard in the Analytics
2. Select a daily rate metric:
• Oil (bbl/d)
• Gas (Mcf/d)
• Water (bbl/d)
The chart will display calculated daily production values.
Read more about options on the production charts and scroll down to "Volume Type" in this article for more information on all the volume options and the definitions for each: There are a lot of options in the production chart....what do they do?
Monthly Production or Type Curve Charts
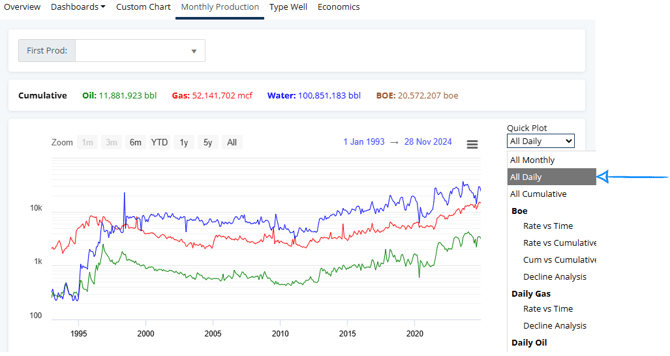
1. Open the Monthly Production or Type Curve tab
2. Use the Quick Plot dropdown
3. Select All Daily
The chart will update to display daily values.
To show both monthly and daily values on the same chart:
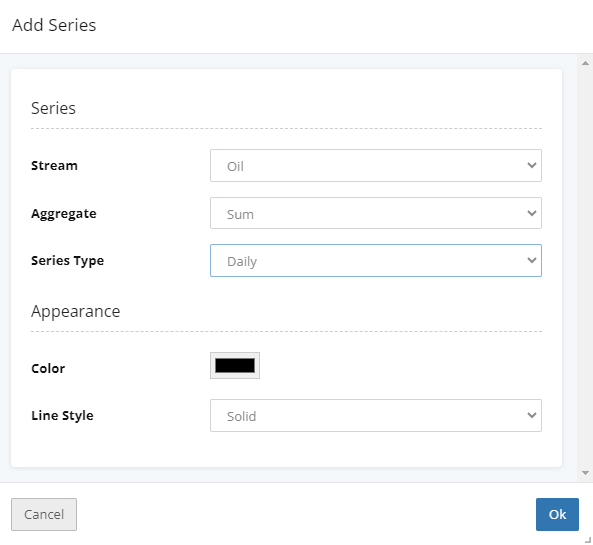
On the Monthly Production or Type Curve tabs, click "Add Series"
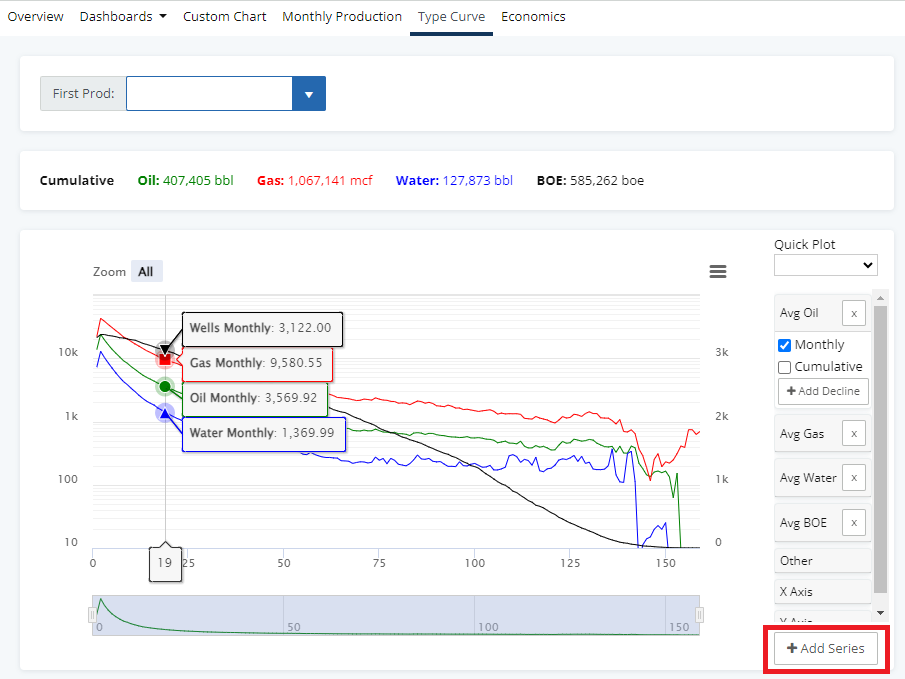
Then daily from the series type dropdown.
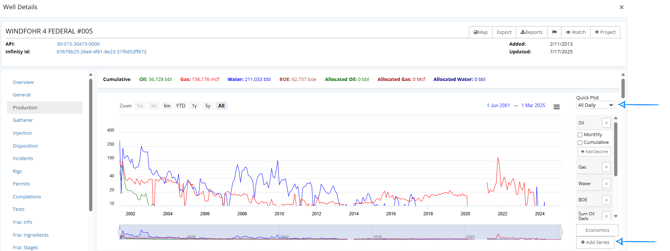
Well Details Card
1. Open the Well Detail page
2. Select the Production tab
3. Use Quick Plot → All Daily or Add Series
How Daily Production is Calculated
Production data is reported by most state agencies as monthly volumes.
Daily production values in WellDatabase are calculated using:
• Total monthly production
• Number of producing days in that month
For example:
Monthly Oil = 9,300 barrels
Days Producing = 31
Daily Oil Rate = 300 bbl/d
This provides a normalized daily production rate for charting and comparison.
Frequently Asked Questions
Q: Is daily production reported daily?
No. Most state agencies report production monthly. WellDatabase calculates daily production values from monthly totals.
Q: Why do daily values sometimes change?
Daily values may change if:
• The monthly production volume is updated
• Producing days are corrected
• State data revisions occur
Related Articles
Explore additional articles by searching the topics on the left. If you have any questions, feel free to email support@welldatabase.com