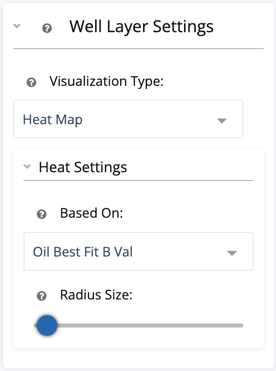
Heat maps are very useful when trying to identify broad trends on a large data set. All you need to do to make a heat map is change the Visualization Type to Heat Map. From there, just specify the property you want the heat map to be based on and set the radius size. The radius size allows you to blend spots together as it increases.
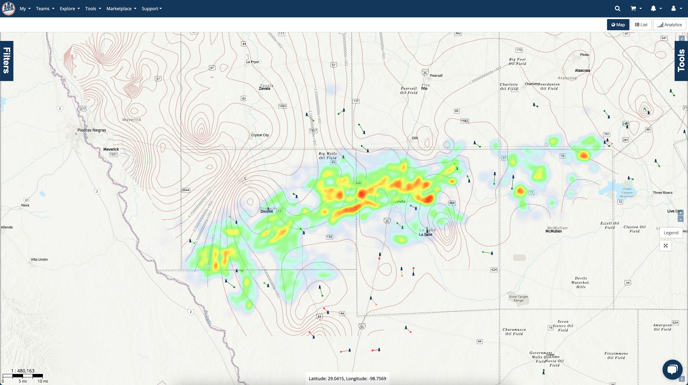
Below we have two heat maps using the same property, just with different radius sizes. The first separates out the well values where they are more distinctive.
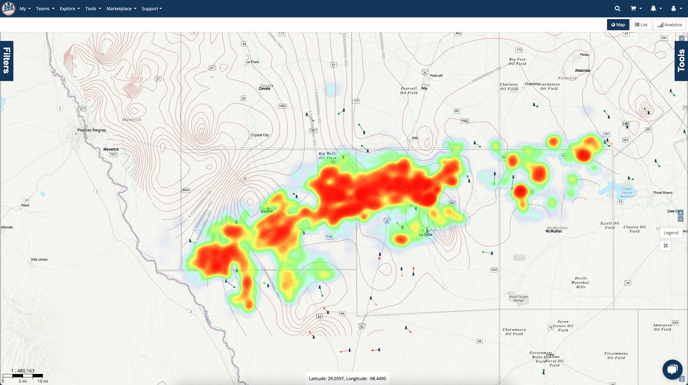
By raising the radius, we allow the larger values to bleed into each other and create a wider trend in our map area.
With all of the map options in WellDatabase, there is next to nothing you can’t do.